

Question: i need to know the formula on Excel also. Analysis of return on invested assets, comparison of two divisions, DuPont method. Performance Aid, Inc. has
i need to know the formula on Excel also.
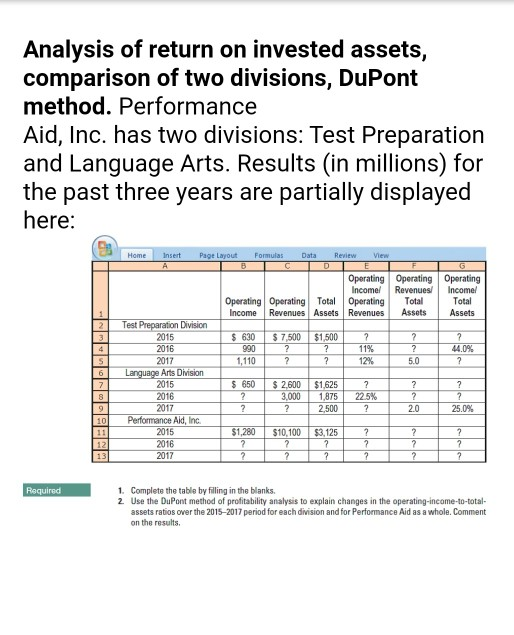
Analysis of return on invested assets, comparison of two divisions, DuPont method. Performance Aid, Inc. has two divisions: Test Preparation and Language Arts. Results (in millions) for the past three years are partially displayed here: 2 3 4 S Home Insert Page Layout Formulas Data Review View A B D Operating Operating Operating Incomel Revenues Incomel Operating Operating Total Operating Total Total Income Revenues Assets Revenues Assets Assets Test Preparation Division 2015 $ 630 $ 7,500 $1,500 ? ? 2 2016 990 2 ? 11% ? 44.0% 2017 1,110 ? ? 12% 5.0 ? Language Arts Division 2015 $ 650 $ 2,600 $1,625 ? ? ? 2016 ? 3,000 1,875 22.5% ? ? 2017 ? ? 2,500 ? 2.0 25.0% Performance Aid, Inc 2015 $1,280 $10,100 $3,125 ? 7 ? 2016 ? ? ? ? ? ? 2017 2 ? ? ? ? ? 6 7 8 9 10 11 12 13 Required 1. Complete the table by filling in the blanks. 2. Use the DuPont method of profitability analysis to explain changes in the operating-income-to-total- assets ratios over the 2015-2017 period for each division and for Performance Aid as a whole. Comment on the results
Step by Step Solution
There are 3 Steps involved in it

Get step-by-step solutions from verified subject matter experts