

Question: I need to know the solutions for this question : 2 1. A random sample of 36 orders at a fast food restaurant was studied
I need to know the solutions for this question
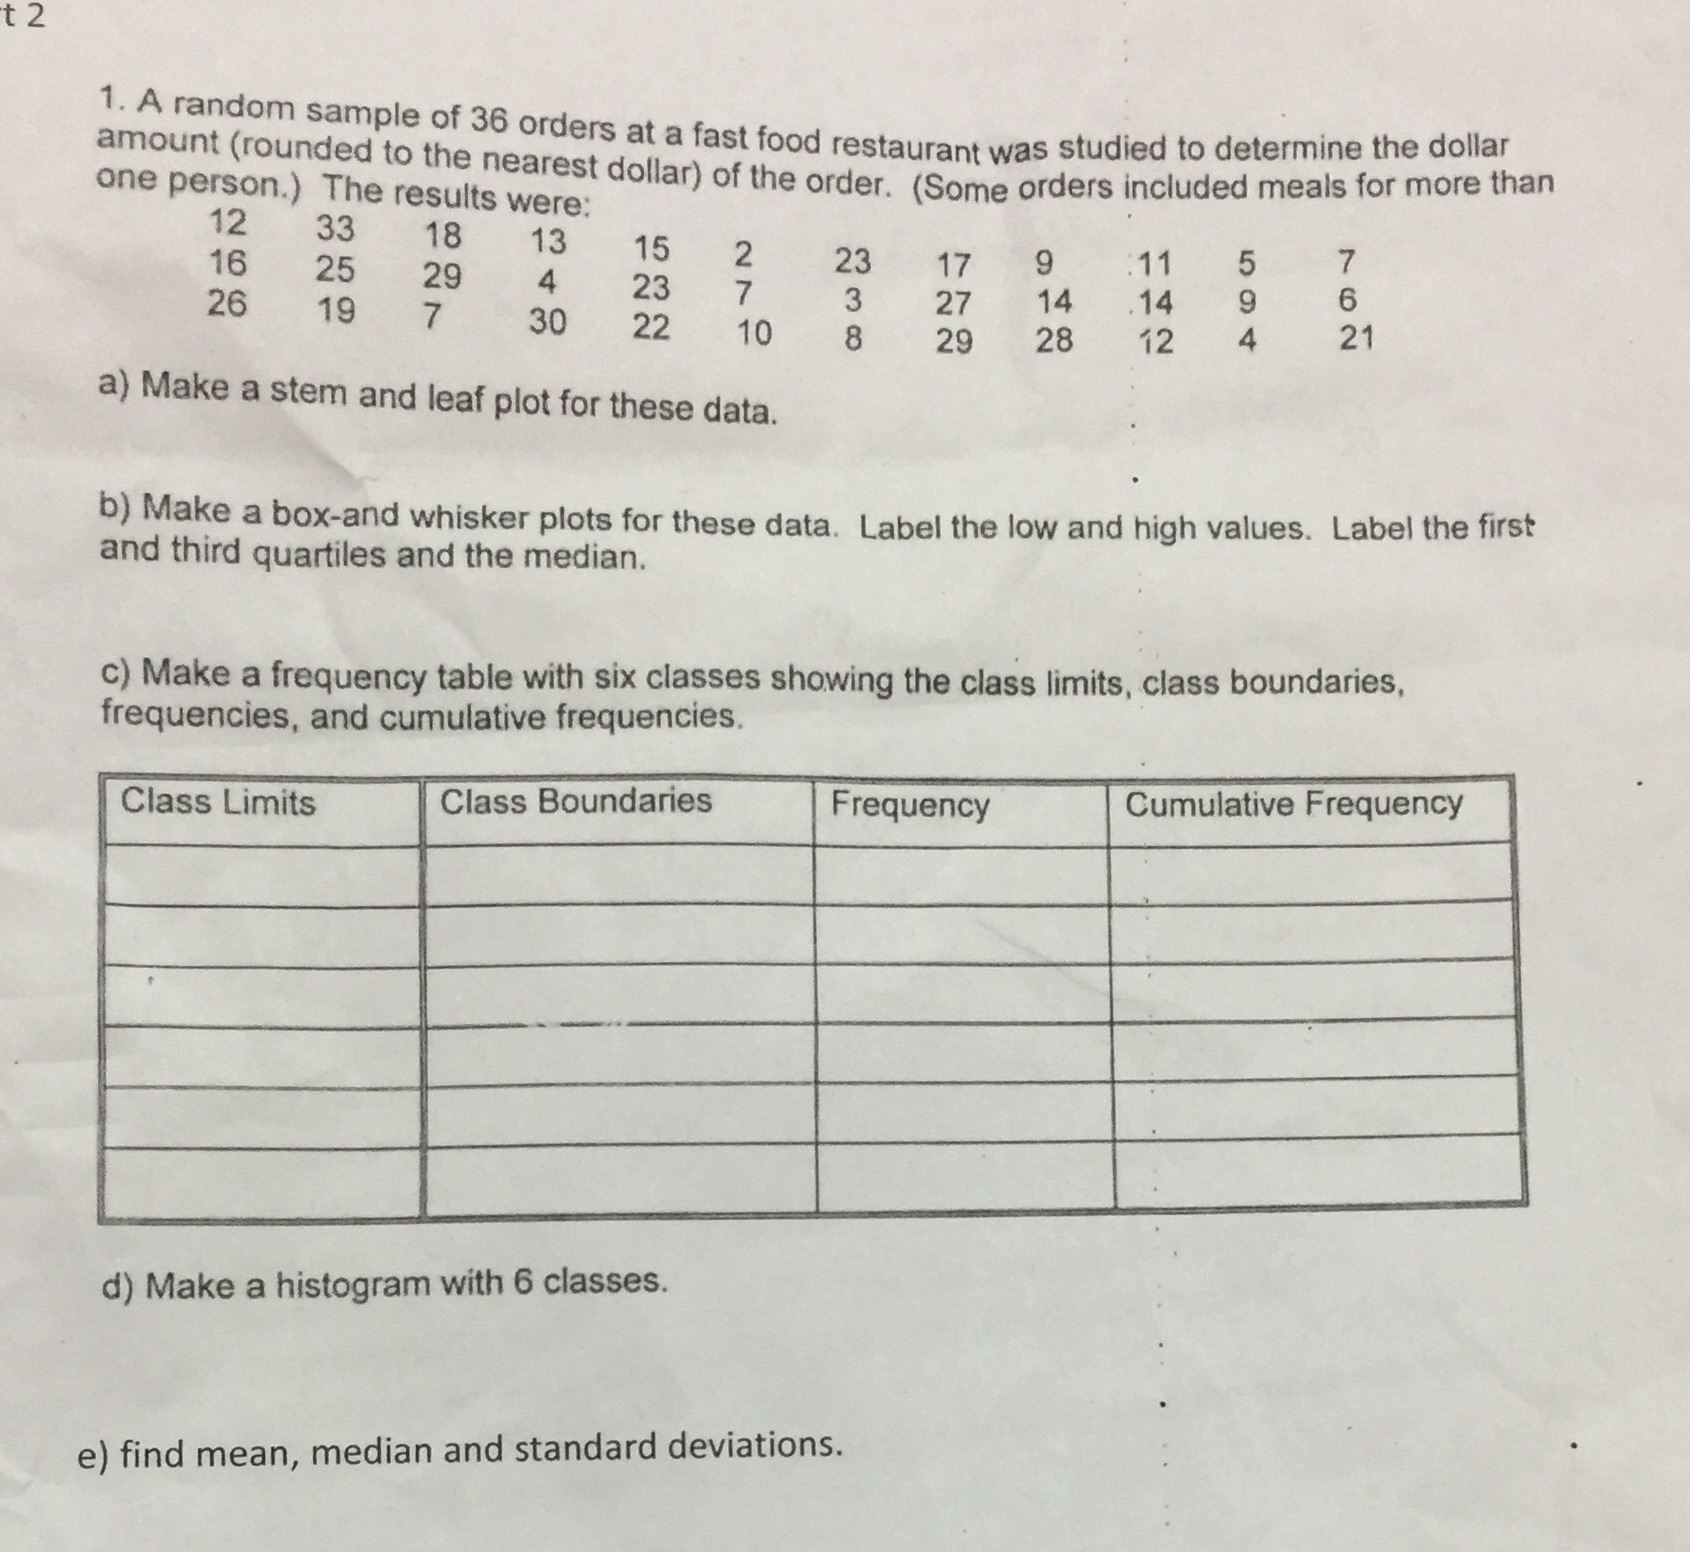
: 2 1. A random sample of 36 orders at a fast food restaurant was studied to determine the dollar amount (rounded to the nearest dollar) of the order. (Some orders included meals for more than one person.) The results were: 12 33 18 13 16 25 15 17 9 11 5 29 4 26 7 23 IN 23 19 3 27 14 14 9 30 22 10 8 29 28 12 4 21 a) Make a stem and leaf plot for these data. b) Make a box-and whisker plots for these data. Label the low and high values. Label the first and third quartiles and the median. c) Make a frequency table with six classes showing the class limits, class boundaries, frequencies, and cumulative frequencies. Class Limits Class Boundaries Frequency Cumulative Frequency d) Make a histogram with 6 classes. e) find mean, median and standard deviations
Step by Step Solution
There are 3 Steps involved in it

Get step-by-step solutions from verified subject matter experts