

Question: I need to plot a portfolio frontier for 5 risky assets. I have done the efficient frontier and the current portfolio point, just missing CAL.
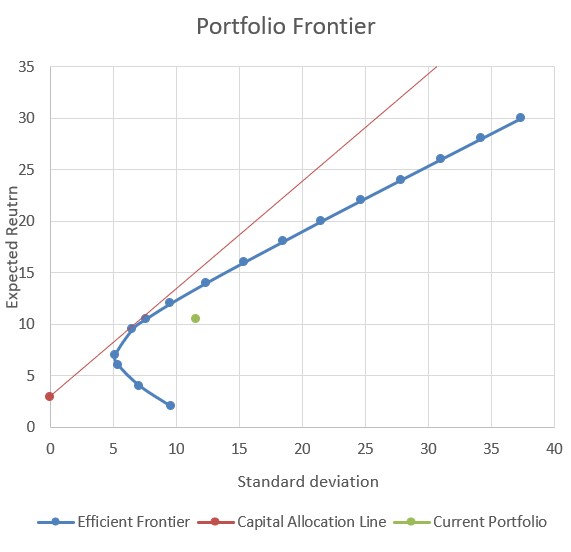
I need to plot a portfolio frontier for 5 risky assets. I have done the efficient frontier and the current portfolio point, just missing CAL.
Is it always necessary to have risk-free assets in order to get the CAL line? This portfolio does not include the risk-free aseet. Also the risk-free rate is fixed, since the data for monthly return of T-bill is given, only one possible risk-free rate 2.91% from that.
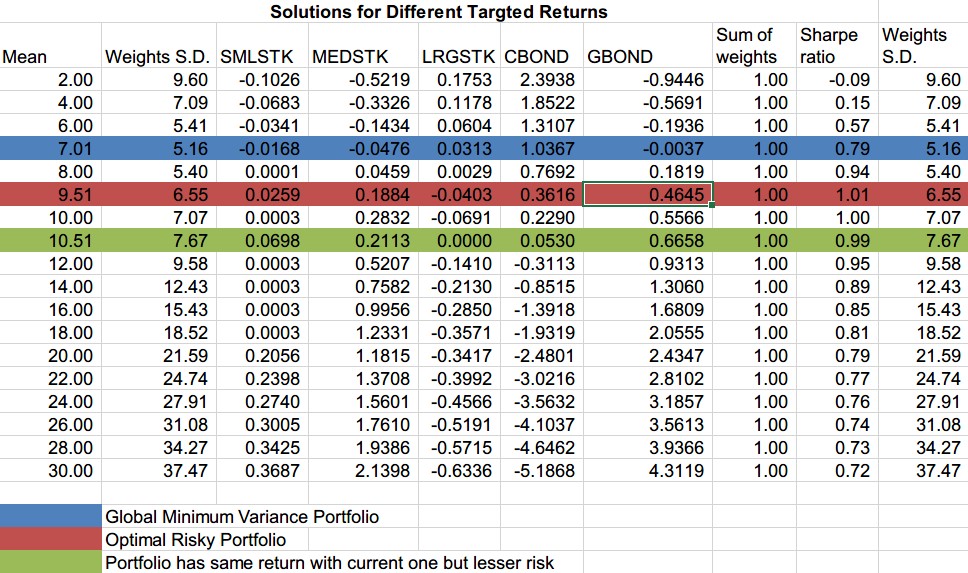
Here are my calculations for this part that can generate the portfolio frontier.


Solutions for Different Targted Returns Sum of Sharpe Weights Mean Weights S.D. SMLSTK MEDSTK LRGSTK CBOND GBOND weights ratio S.D. 2.00 9.60 -0.1026 -0.5219 0.1753 2.3938 -0.9446 1.00 -0.09 9.60 4.00 7.09 -0.0683 -0.3326 0.1178 1.8522 -0.5691 1.00 0.15 7.09 6.00 5.41 -0.0341 -0.1434 0.0604 1.3107 -0. 1936 1.00 0.57 5.41 7.01 5.16 -0.0168 -0.0476 0.0313 1.0367 -0.0037 1.00 0.79 5.16 8.00 5.40 0.0001 0.0459 0.0029 0.7692 0.1819 1.00 0.94 5.40 9.51 6.55 0.0259 0.1884 -0.0403 0.3616 0.4645 1.00 1.01 6.55 10.00 7.07 0.0003 0.2832 -0.0691 0.2290 0.5566 1.00 1.00 7.07 10.51 7.67 0.0698 0.2113 0.0000 0.0530 0.6658 1.00 0.99 7.67 12.00 9.58 0.0003 0.5207 -0.1410 -0.3113 0.9313 1.00 0.95 9.58 14.00 12.43 0.0003 0.7582 -0.2130 -0.8515 1.3060 1.00 0.89 12.43 16.00 15.43 0.0003 0.9956 -0.2850 -1.3918 1.6809 1.00 0.85 15.43 18.00 18.52 0.0003 1.2331 -0.3571 -1.9319 2.0555 1.00 0.81 18.52 20.00 21.59 0.2056 1.1815 -0.3417 -2.4801 2.4347 1.00 0.79 21.59 22.00 24.74 0.2398 1.3708 -0.3992 -3.0216 2.8102 1.00 0.77 24.74 24.00 27.91 0.2740 1.5601 -0.4566 -3.5632 3.1857 1.00 0.76 27.91 26.00 31.08 0.3005 1.7610 -0.5191 -4.1037 3.5613 1.00 0.74 31.08 28.00 34.27 0.3425 1.9386 -0.5715 -4.6462 3.9366 1.00 0.73 34.27 30.00 37.47 0.3687 2.1398 -0.6336 -5.1868 4.3119 1.00 0.72 37.47 Global Minimum Variance Portfolio Optimal Risky Portfolio Portfolio has same return with current one but lesser risk
Step by Step Solution
There are 3 Steps involved in it

Get step-by-step solutions from verified subject matter experts