

Question: I NEED TO SEE HOW TO GRAPH! 1. An operations manager is deciding on the level of automation for a new process. The fixed cost
 I NEED TO SEE HOW TO GRAPH!
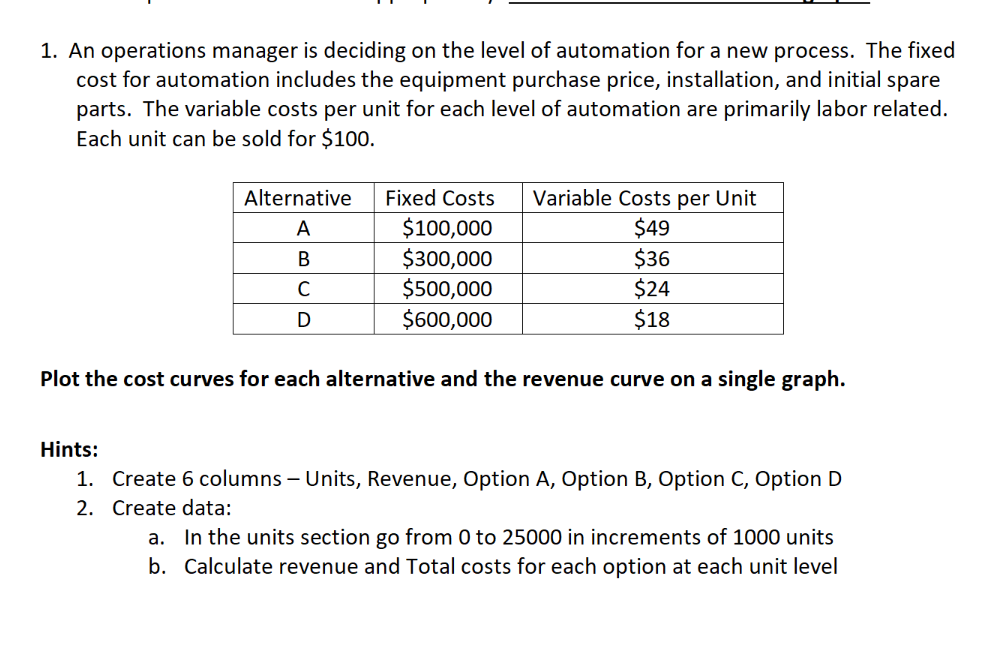
1. An operations manager is deciding on the level of automation for a new process. The fixed cost for automation includes the equipment purchase price, installation, and initial spare parts. The variable costs per unit for each level of automation are primarily labor related. Each unit can be sold for $100. Plot the cost curves for each alternative and the revenue curve on a single graph. Hints: 1. Create 6 columns - Units, Revenue, Option A, Option B, Option C, Option D 2. Create data: a. In the units section go from 0 to 25000 in increments of 1000 units b. Calculate revenue and Total costs for each option at each unit level
Step by Step Solution
There are 3 Steps involved in it

Get step-by-step solutions from verified subject matter experts