Question: I need to solve it with explanation. Match and Offset. Name the range C6 TableStart Name Cell 116 Itemi Name Cell E16 Item2 Name the
I need to solve it with explanation. 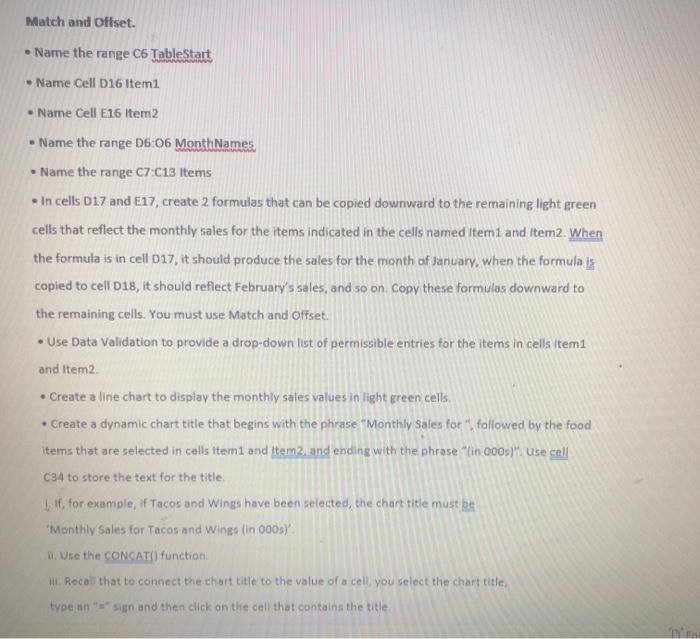
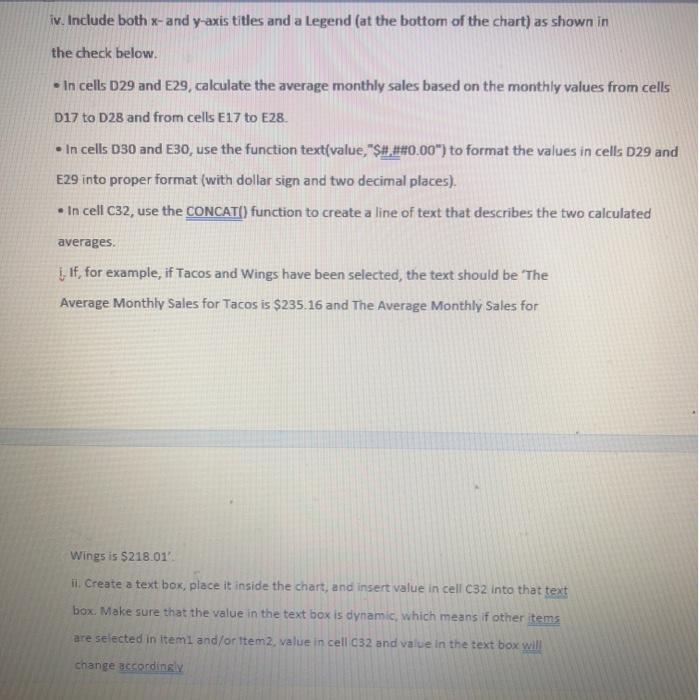
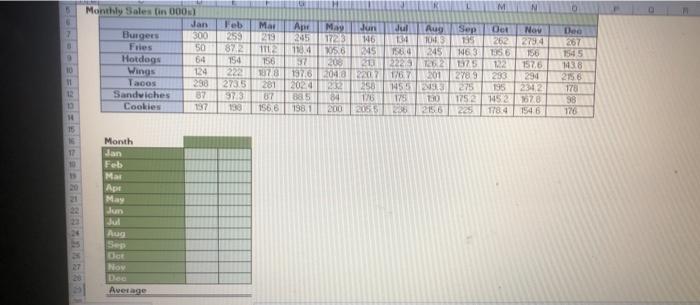
Match and Offset. Name the range C6 TableStart Name Cell 116 Itemi Name Cell E16 Item2 Name the range 06:06 MonthNames. Name the range C7.C13 Items In cells D17 and E17, create 2 formulas that can be copied downward to the remaining light green cells that reflect the monthly sales for the items indicated in the cells named Item1 and Item2. When the formula is in cell 017, it should produce the sales for the month of January, when the formula is copied to cell 018, it should reflect February's sales, and so on Copy these formulos downward to the remaining cells. You must use Match and Offset. Use Data Validation to provide a drop-down list of permissible entries for the items in cells itemi and Item2 Create a line chart to display the monthly sales values in light green cells Create a dynamic chart title that begins with the phrase "Monthly Sales for followed by the food items that are selected in cells itemi and item2, and ending with the phrase "in 000) Use cell C34 to store the text for the title If, for example, if Tacos and Wings have been selected, the chart title must Monthly Sales for Tacos and Wings (in 00s) Ure the CONCAT() function Recall that to connect the chart title to the value of a cell, you select the chart title type an "sign and then click on the cell that contains the title iv. Include both x-and y-axis titles and a Legend (at the bottom of the chart) as shown in the check below. In cells D29 and E29, calculate the average monthly sales based on the monthly values from cells 017 to D28 and from cells E17 to E28. In cells D30 and E30, use the function text(value, "$#.##0.00") to format the values in cells D29 and E29 into proper format (with dollar sign and two decimal places) In cell c32, use the CONCAT() function to create a line of text that describes the two calculated averages If, for example, if Tacos and Wings have been selected, the text should be 'The Average Monthly Sales for Tacos is $235.16 and The Average Monthly Sales for Wings is $218.01 il. Create a text box, place it inside the chart, and insert value in cell C32 into that text box. Make sure that the value in the text box is dynamic, which means if other items are selected in itemi and/or item 2 value in cell 032 and value in the text box will change accordingly TRAIL M Jun Feb 259 872 135 Monthly sales in 0005 Jan Burgers 300 50 Hotdogs 64 Wings 124 Tacos 298 Sandwiches 37 Cookies 154 222 Mar 219 111 156 1978 281 87 1566 An 285 11834 37 1976 2024 Bas 1981 May 1723 146 1056 245 200 20 20402 202 258 84 176 200 125 dul 134 1584 2222 1167 1455 178 236 Aug Sep Det Nov 1043 2622794 245 1463 1356 156 12 122 1576 201 2789 294 275 195 2342 130 1752 14521670 2156225 1784 1546 233 Ded 267 1545 1438 2156 178 98 176 13 373 130 14 Month an Feb Mar Apl May Jun Jul Aug Sey Der Now Dee Average 27


