Question: I need to solve this issue on EXCEL SOLVER only!! This question is related to Supply Chain Management Question: There is a company named Tomato
I need to solve this issue on EXCEL SOLVER only!!
This question is related to Supply Chain Management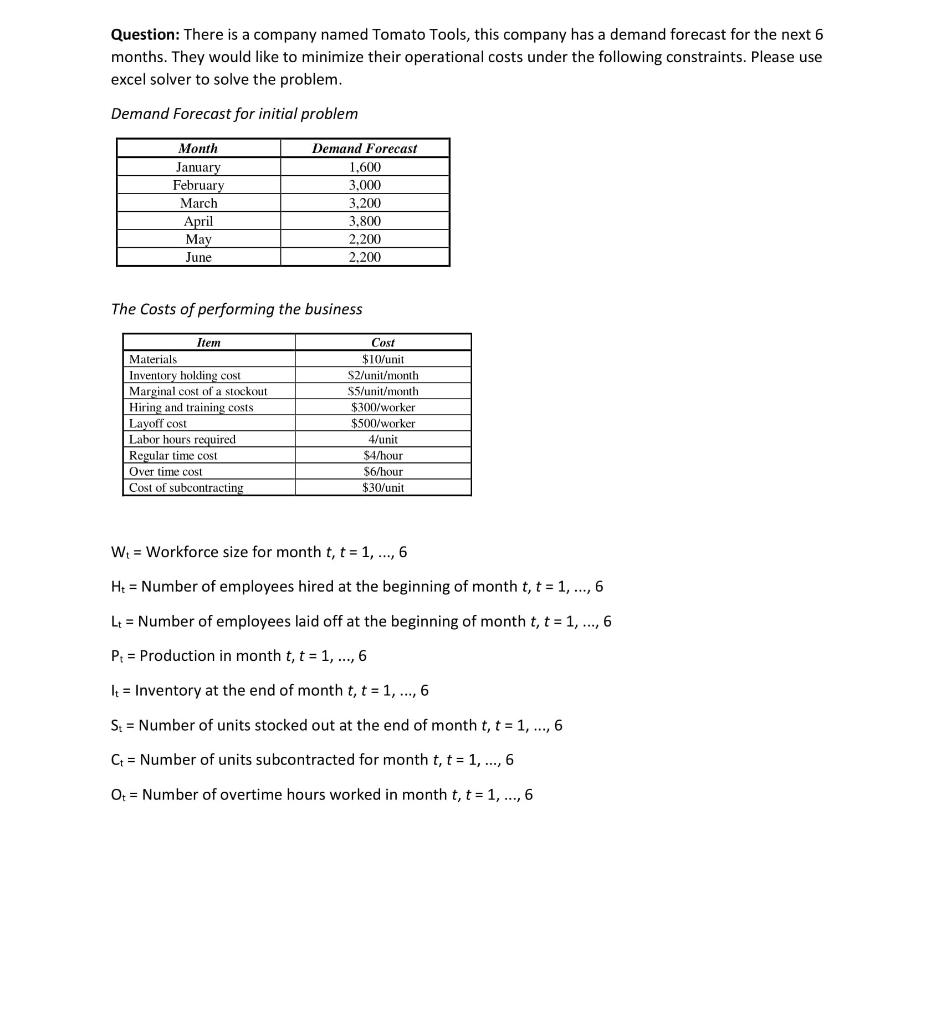
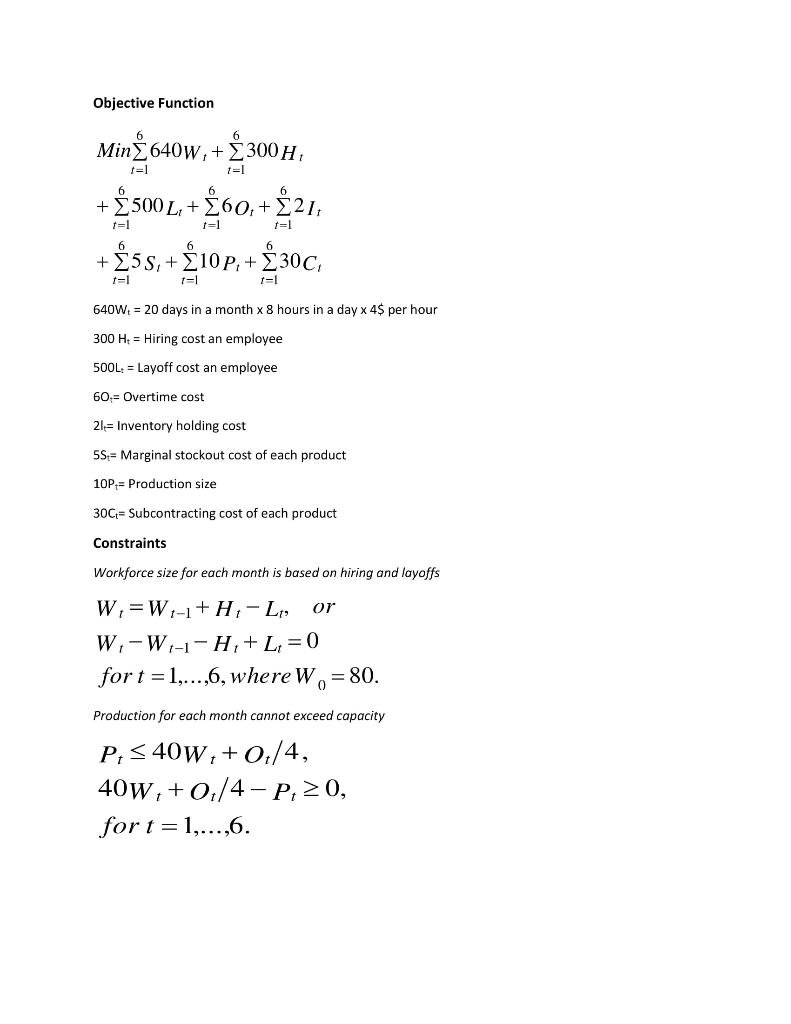
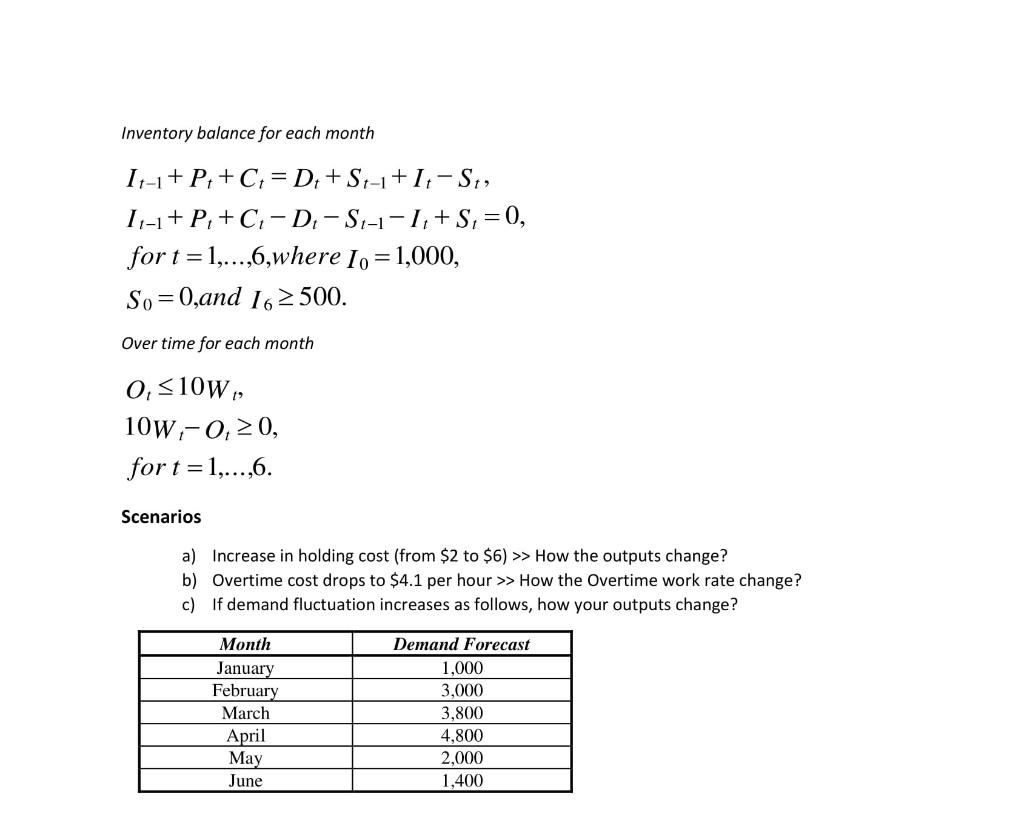
Question: There is a company named Tomato Tools, this company has a demand forecast for the next 6 months. They would like to minimize their operational costs under the following constraints. Please use excel solver to solve the problem. Demand Forecast for initial problem Month Demand Forecast January February March April May June 1,600 3.000 3.200 3,800 2.200 2.200 The Costs of performing the business Item Materials Inventory holding cost Marginal cost of a stockout Hiring and training costs Layoff cost Labor hours required Regular time cost Over time cost Cost of subcontracting Cost $10/unit S2/unit/month S5/unit/month $300/worker $500/worker 4/unit $4/hour $6/hour $30/unit W = Workforce size for month t, t = 1, ..., 6 H+ = Number of employees hired at the beginning of month t, t = 1, ..., 6 Lt = Number of employees laid off at the beginning of month t, t = 1, ..., 6 P = Production in month t, t = 1, ..., 6 It = Inventory at the end of month t, t = 1, ..., 6 St = Number of units stocked out at the end of month t, t = 1,..., 6 Ct = Number of units subcontracted for month t, t = 1, ..., 6 Ot = Number of overtime hours worked in month t, t = 1, ..., 6 Objective Function 6 Min 640w, + 300 h, 1=1 6 6 6 t=1 + 500 L, + 60, + 2, 60; + 55, + 10P, + 30C, 6 6 6 t=1 1=1 t=1 640W = 20 days in a month x 8 hours in a day x 4$ per hour 300 H4 = Hiring cost an employee 500L: = Layoff cost an employee 60,- Overtime cost 21.= Inventory holding cost 55= Marginal stockout cost of each product 10P = Production size 30C = Subcontracting cost of each product Constraints Workforce size for each month is based on hiring and layoffs or W=W-1+H-L W-W-1-H+L; = 0 for t = 1,...,6, where W. = 80. Production for each month cannot exceed capacity P, S 40w, +0/4, 40W, +0,/4-P, 20, for t = 1,...,6. Inventory balance for each month 11-1+ P +C; = D. + St-1+1,-S, 1,-1+ P,+C;-D-S2-1-1,+S, = 0, for t = 1,...,6,where 10 = 1,000, So=0,and 16 > 500. Over time for each month 0, > How the outputs change? b) Overtime cost drops to $4.1 per hour >> How the Overtime work rate change? c) If demand fluctuation increases as follows, how your outputs change? Month January February March April May June Demand Forecast 1,000 3,000 3,800 4,800 2,000 1,400 Question: There is a company named Tomato Tools, this company has a demand forecast for the next 6 months. They would like to minimize their operational costs under the following constraints. Please use excel solver to solve the problem. Demand Forecast for initial problem Month Demand Forecast January February March April May June 1,600 3.000 3.200 3,800 2.200 2.200 The Costs of performing the business Item Materials Inventory holding cost Marginal cost of a stockout Hiring and training costs Layoff cost Labor hours required Regular time cost Over time cost Cost of subcontracting Cost $10/unit S2/unit/month S5/unit/month $300/worker $500/worker 4/unit $4/hour $6/hour $30/unit W = Workforce size for month t, t = 1, ..., 6 H+ = Number of employees hired at the beginning of month t, t = 1, ..., 6 Lt = Number of employees laid off at the beginning of month t, t = 1, ..., 6 P = Production in month t, t = 1, ..., 6 It = Inventory at the end of month t, t = 1, ..., 6 St = Number of units stocked out at the end of month t, t = 1,..., 6 Ct = Number of units subcontracted for month t, t = 1, ..., 6 Ot = Number of overtime hours worked in month t, t = 1, ..., 6 Objective Function 6 Min 640w, + 300 h, 1=1 6 6 6 t=1 + 500 L, + 60, + 2, 60; + 55, + 10P, + 30C, 6 6 6 t=1 1=1 t=1 640W = 20 days in a month x 8 hours in a day x 4$ per hour 300 H4 = Hiring cost an employee 500L: = Layoff cost an employee 60,- Overtime cost 21.= Inventory holding cost 55= Marginal stockout cost of each product 10P = Production size 30C = Subcontracting cost of each product Constraints Workforce size for each month is based on hiring and layoffs or W=W-1+H-L W-W-1-H+L; = 0 for t = 1,...,6, where W. = 80. Production for each month cannot exceed capacity P, S 40w, +0/4, 40W, +0,/4-P, 20, for t = 1,...,6. Inventory balance for each month 11-1+ P +C; = D. + St-1+1,-S, 1,-1+ P,+C;-D-S2-1-1,+S, = 0, for t = 1,...,6,where 10 = 1,000, So=0,and 16 > 500. Over time for each month 0, > How the outputs change? b) Overtime cost drops to $4.1 per hour >> How the Overtime work rate change? c) If demand fluctuation increases as follows, how your outputs change? Month January February March April May June Demand Forecast 1,000 3,000 3,800 4,800 2,000 1,400


