

Question: i need to solve this question plz 1) A student measured the following displacement data for a toy car moving at constant velocity: Time (S)
i need to solve this question plz
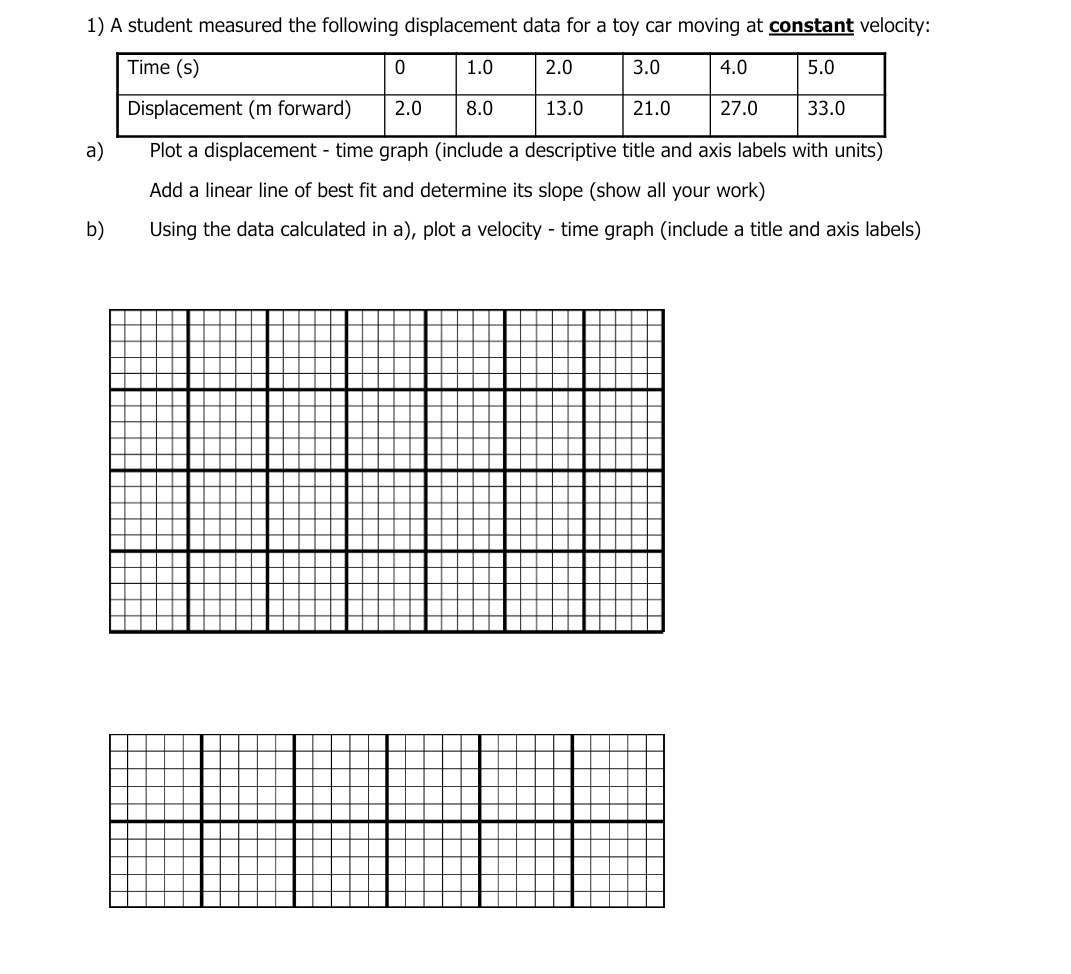
1) A student measured the following displacement data for a toy car moving at constant velocity: Time (S) 0 1.0 2.0 3.0 4.0 5.0 Displacement (m forward) 2.0 8.0 13.0 21.0 27.0 33.0 a ) Plot a displacement - time graph (include a descriptive title and axis labels with units) Add a linear line of best fit and determine its slope (show all your work) b) Using the data calculated in a), plot a velocity - time graph (include a title and axis labels)
Step by Step Solution
There are 3 Steps involved in it
1 Expert Approved Answer
Step: 1 Unlock

Question Has Been Solved by an Expert!
Get step-by-step solutions from verified subject matter experts
Step: 2 Unlock
Step: 3 Unlock