

Question: I need to use Exel Solver for this. I am having trouble defining the contraints, objective and variables for this. Question is below He has
I need to use Exel Solver for this. I am having trouble defining the contraints, objective and variables for this. Question is below
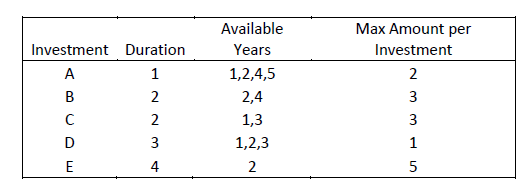
He has set aside $5 million to initially place into this portfolio, and will not add any other funds later. Any investment proceeds realized during the five-year window will be reinvested. The goal is to generate as much money as possible by the end of the fifth year. For brevity, we will call the investments A, B, C, D, and E. The below table shows the years that each investment can be invested in, the duration of time until the investments mature, and the maximum amount that can be invested in each investment (per period). For example, investment C can be invested in up to two times: at the beginning of year 1 or at the beginning of year 3. Each time the maximum investment amount is $3 million (so, in total, $6 million could be placed in this investment).
The returns from the investments are shown below. These returns are realized when an investment matures (i.e., they are not all annual returns). Some investments have variable returns that are based on the year in which the investment was made, while others return the same amount no matter when the investment was made. There is also an option to invest in cash every year. There is no maximum amount for cash investments. Finally, regulations require that the total amount invested in A over the course of the 5 years cannot exceed the combined amount invested in B, C, D, and E over the 5 years.
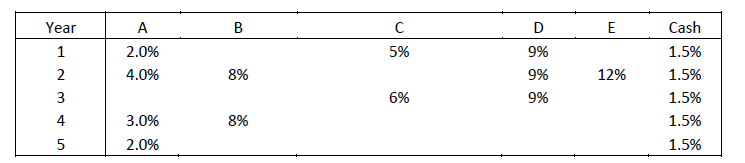
For example, if $1 million is invested in C at the beginning of year 1, Pierre will realize a 5% return at the end of year 2/beginning of year 3 (because the duration of investment C is 2 years). In addition, Pierre would receive his $1 million principle back, so in total he would have $1 million + 0.05*$1 million = $1.05 Million available for reinvestment at the beginning of year 3.
\begin{tabular}{|cccc|} \hline Investment & Duration & AvailableYears & MaxAmountperInvestment \\ \hline A & 1 & 1,2,4,5 & 2 \\ B & 2 & 2,4 & 3 \\ C & 2 & 1,3 & 3 \\ D & 3 & 1,2,3 & 1 \\ E & 4 & 2 & 5 \\ \hline \end{tabular} \begin{tabular}{|c|cccccc|} \hline Year & A & B & C & D & E & Cash \\ \hline 1 & 2.0% & & 5% & 9% & & 1.5% \\ 2 & 4.0% & 8% & & 9% & 12% & 1.5% \\ 3 & & & 6% & 9% & & 1.5% \\ 4 & 3.0% & 8% & & & & 1.5% \\ 5 & 2.0% & & & & & 1.5% \\ \hline \end{tabular}
Step by Step Solution
There are 3 Steps involved in it

Get step-by-step solutions from verified subject matter experts