

Question: i need written answer (without using excel sheet) . step by step explanation please. 23 22 37 47 och. 2. Data on monthly demand for
i need written answer (without using excel sheet) . step by step explanation please.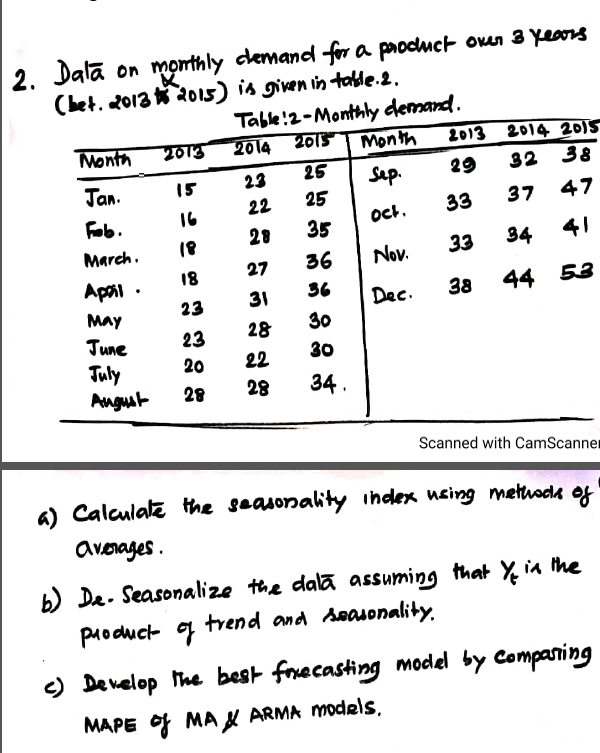
23 22 37 47 och. 2. Data on monthly demand for a product over 3 years (bet. 2013 th 2015) is given in table.2. Table! 2-Monthly demand. Month 2013 2014 2015 Month 2013 2014 2015 26 32 38 29 Sep 15 Jan. 25 Fob. 33 28 35 March 33 34 Nov. 27 18 36 Apari 36 31 23 Dec 38 30 23 28 22 30 August 28 44 53 MAY June July 20 28 34 Scanned with CamScanner a) Calculate the seasonality index using methods of averages b) De Seasonalize the data assuming that ye in the producto q trend and seasonality. c) Develop the best forecasting model by comparing MAPE O MAL ARMA models
Step by Step Solution
There are 3 Steps involved in it

Get step-by-step solutions from verified subject matter experts