

Question: I needed help with the following question. Please take a look. I have included examples, which are labeled examples, to help with the homework. I
I needed help with the following question. Please take a look. I have included examples, which are labeled examples, to help with the homework. I got confused on how to do it. Thanks
Question
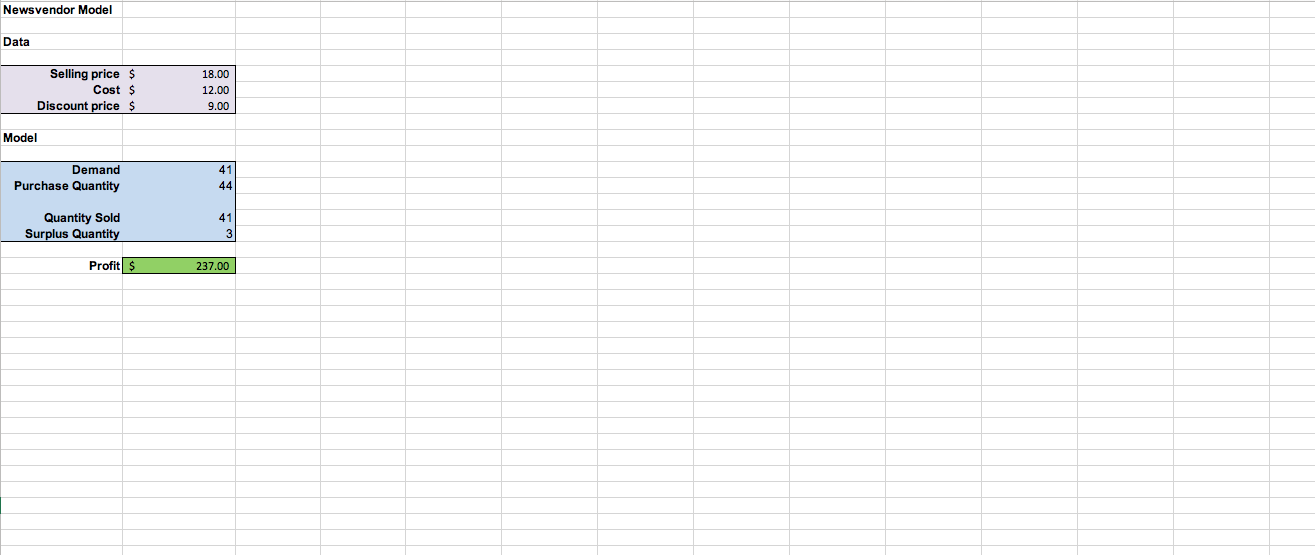
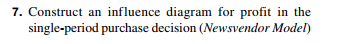
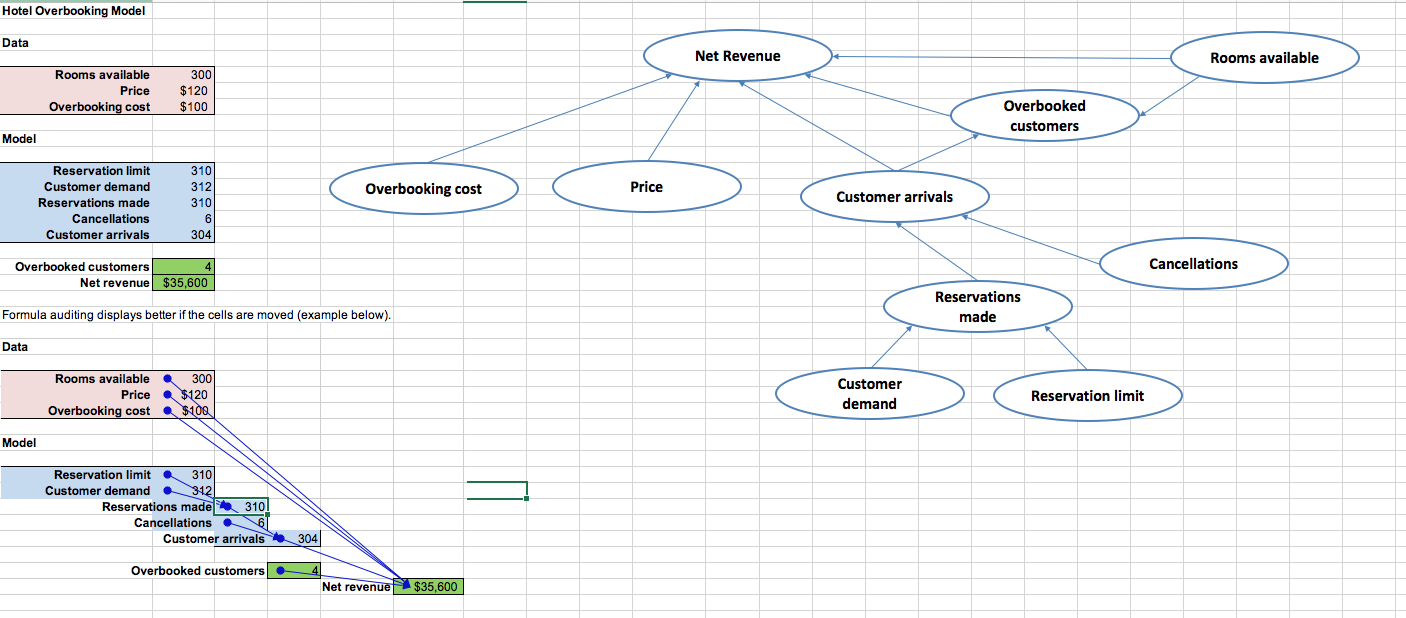
Newsvendor Model Data Selling price $ 18.00 Cost $ 12.00 Discount price 9.00 Model Demand 41 Purchase Quantity 14 Quantity Sold 41 Surplus Quantity 3 Profit $ 237.007. Construct an influence diagram for profit in the single-period purchase decision (Newsvendor Model)discussed in this chapter. Use Excel's Formula Auditing capability to demonstrate the relationship between the spreadsheet model and the influence diagram.Hotel Overbooking Model Data Net Revenue Rooms available Rooms available 300 Price $120 Overbooking cost $100 Overbooked customers Model Reservation limit 310 Customer demand 312 Overbooking cost Price Reservations made 310 Customer arrivals Cancellations Customer arrivals 304 Overbooked customers Cancellations Net revenue $35,600 Reservations Formula auditing displays better if the cells are moved (example below). made Data Rooms available 300 Customer Price $120 Overbooking cost demand Reservation limit $109 Model Reservation limit 310 Customer demand 312 Reservations made 310 Cancellations 6 Customer arrivals 304 Overbooked customers . 4 Net revenue $35,600
Step by Step Solution
There are 3 Steps involved in it

Get step-by-step solutions from verified subject matter experts