

Question: I needed help with this please, thank you! Two boxplots of the FLT rating appear below, one for the new dental treat and one for
I needed help with this please, thank you!
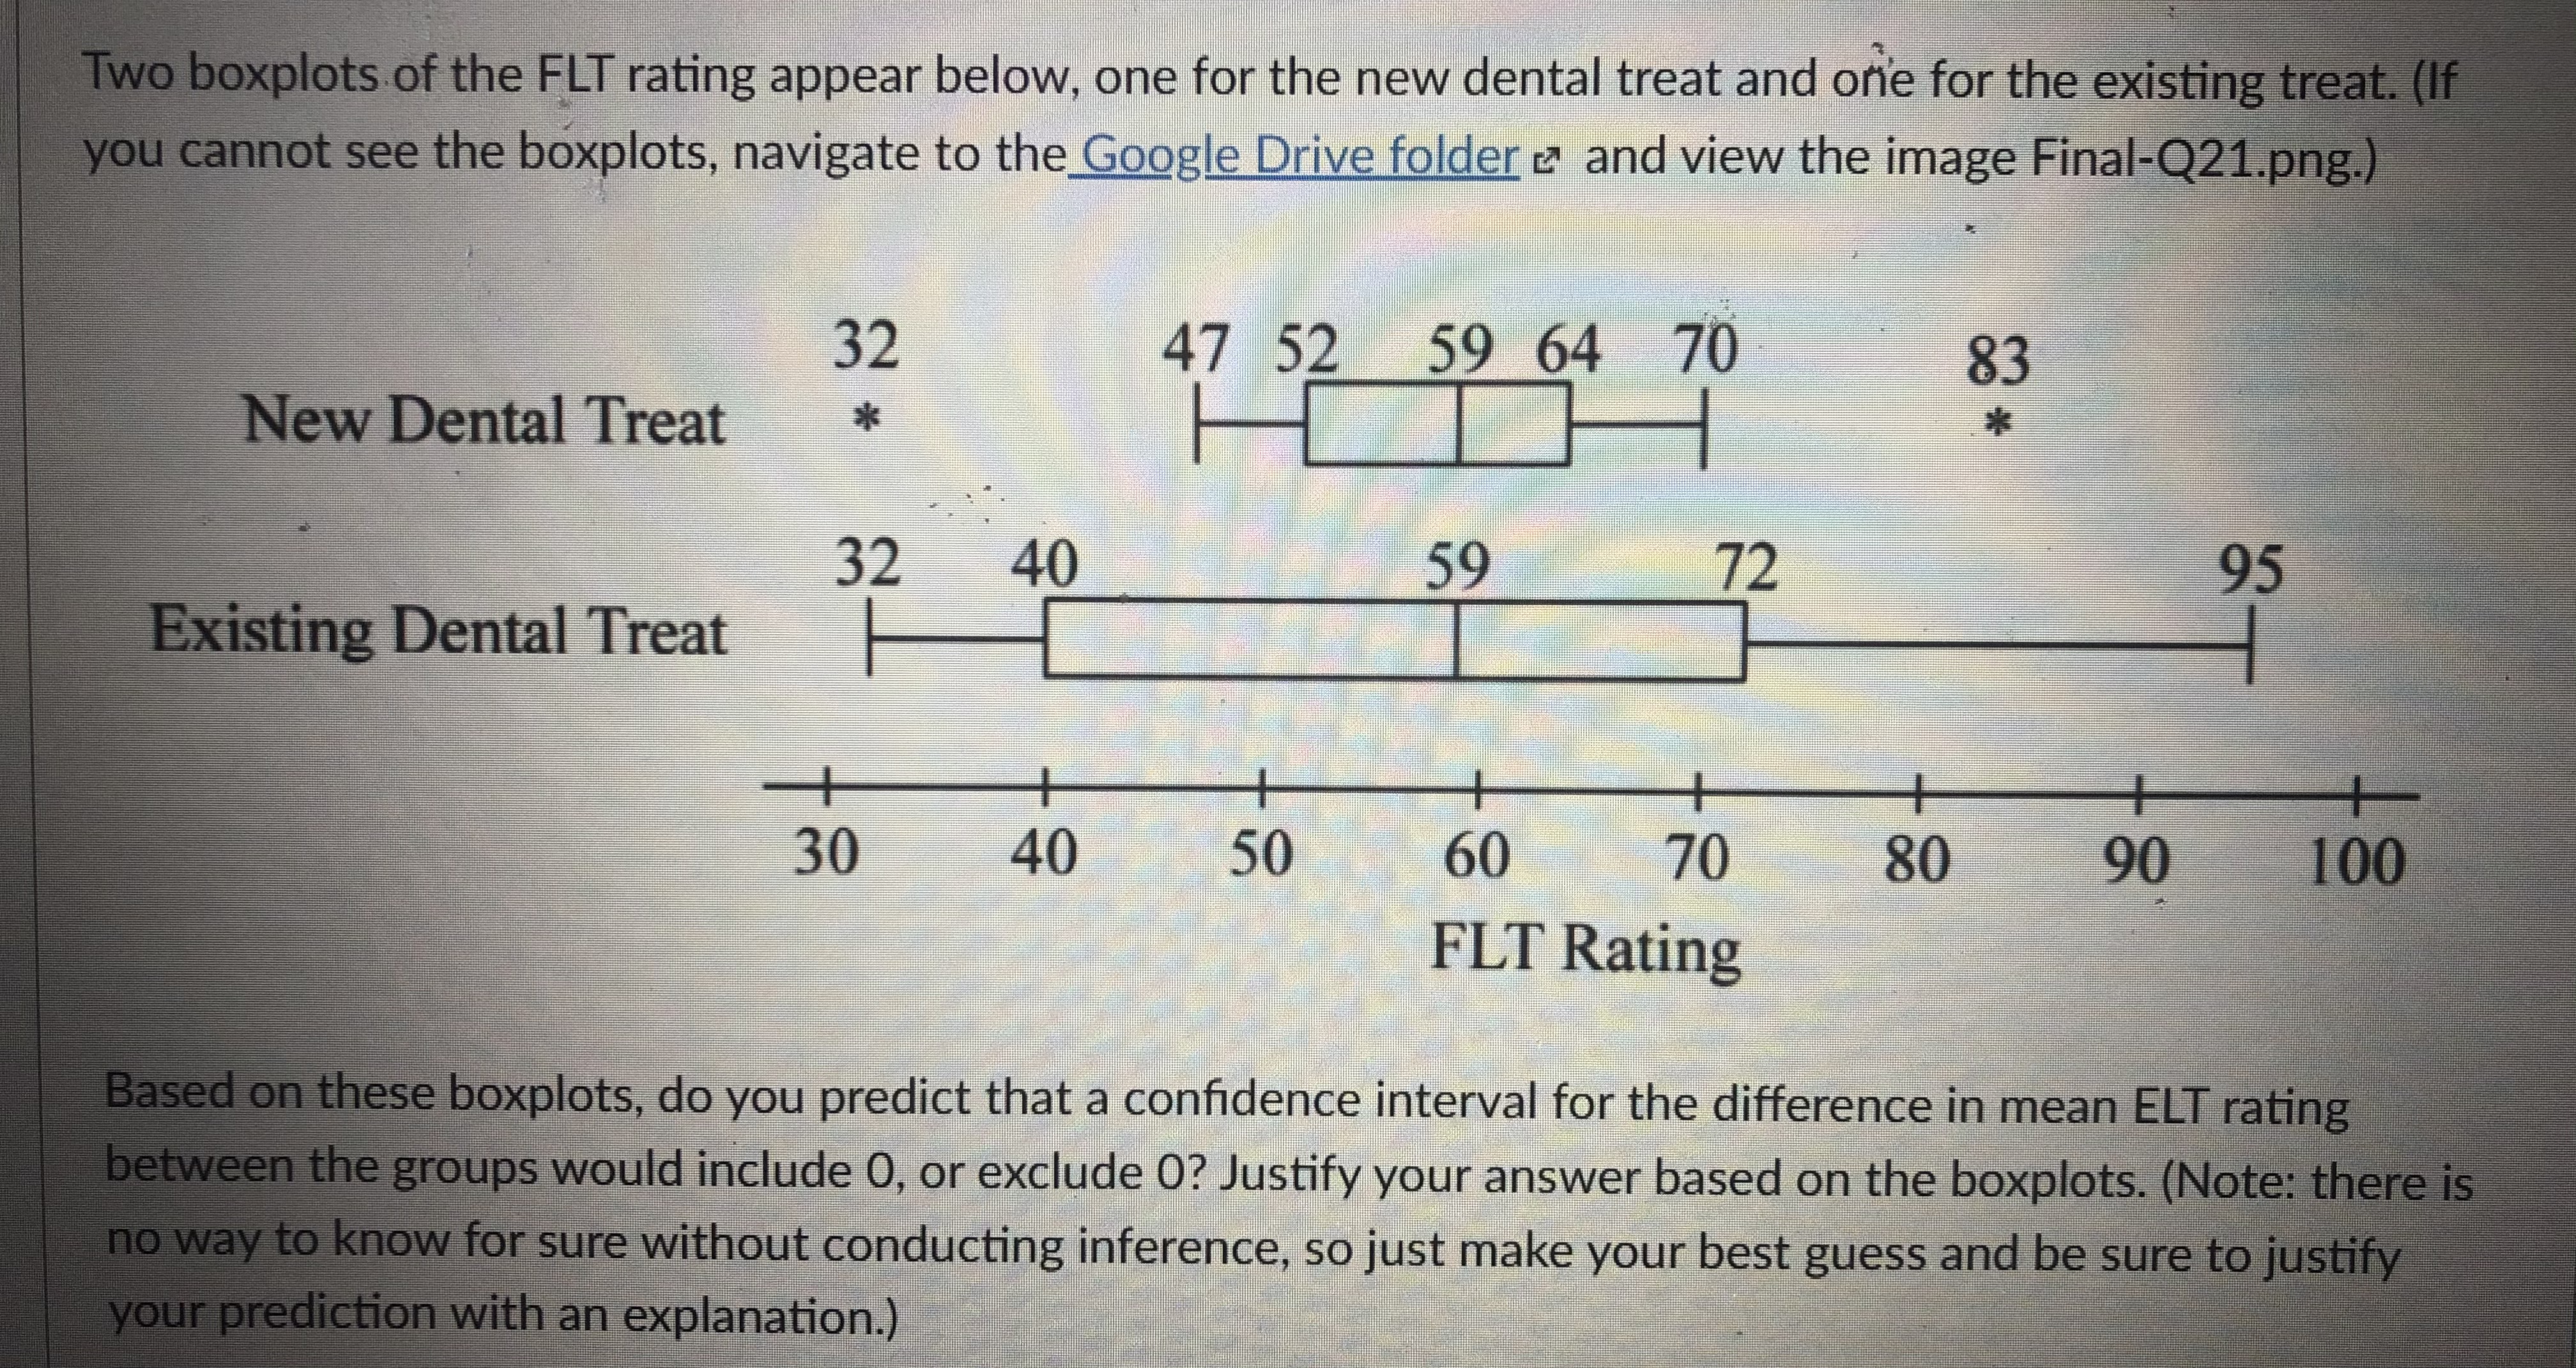
Two boxplots of the FLT rating appear below, one for the new dental treat and one for the existing treat. (If you cannot see the boxplots, navigate to the Google Drive folder & and view the image Final-Q21.png.) 32 47 52 59 64 70 83 New Dental Treat H 32 40 59 72 95 Existing Dental Treat + 30 40 50 60 70 80 90 100 FLT Rating Based on these boxplots, do you predict that a confidence interval for the difference in mean ELT rating between the groups would include 0, or exclude O? Justify your answer based on the boxplots. (Note: there is no way to know for sure without conducting inference, so just make your best guess and be sure to justify your prediction with an explanation.)
Step by Step Solution
There are 3 Steps involved in it

Get step-by-step solutions from verified subject matter experts