

Question: i neef help solving this problem Introduction to a Sample Distribution This activity is intended to help you see the relationship between the mean and
i neef help solving this problem
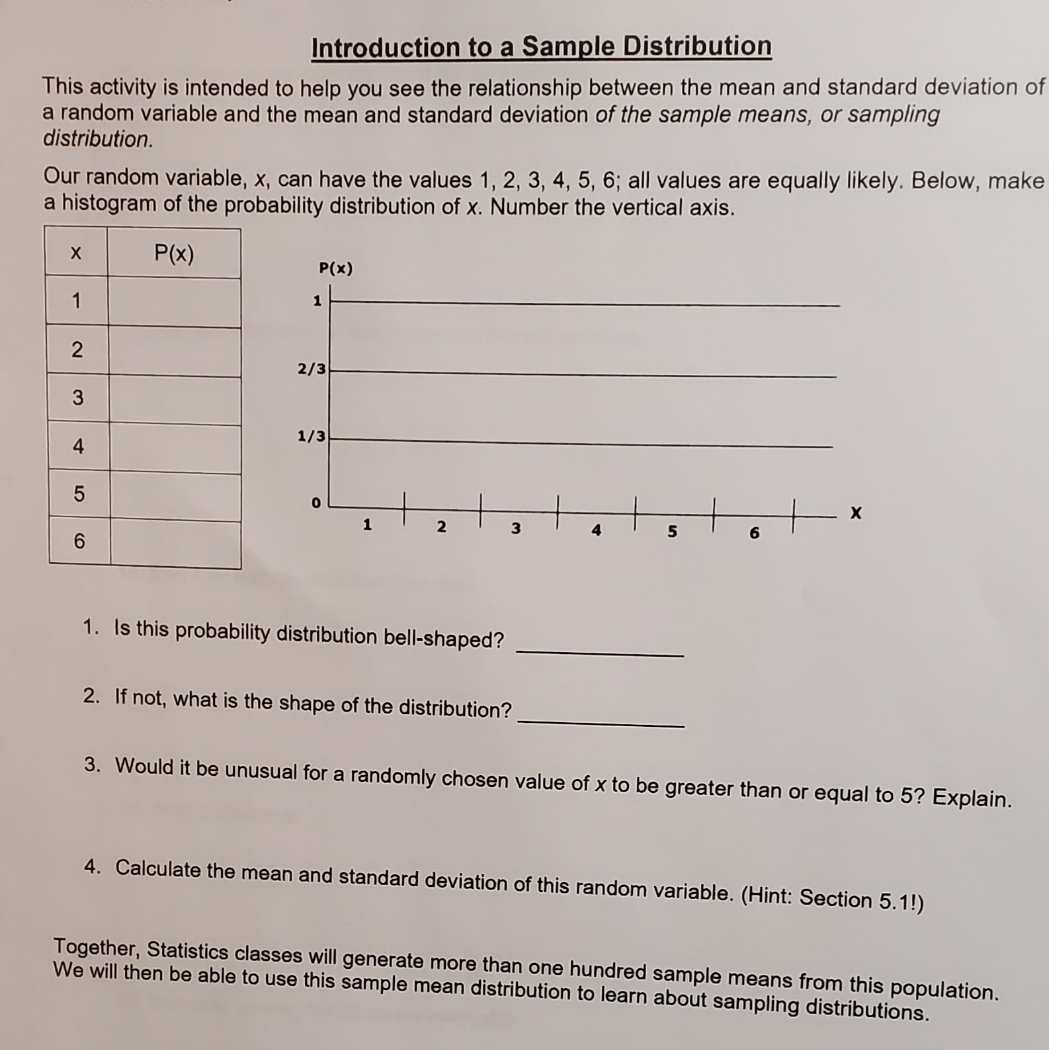
Introduction to a Sample Distribution This activity is intended to help you see the relationship between the mean and standard deviation of a random variable and the mean and standard deviation of the sample means, or sampling distribution. Our random variable, x, can have the values 1, 2, 3, 4, 5, 6; all values are equally likely. Below, make a histogram of the probability distribution of x. Number the vertical axis. X P(x) P(x) 2 2/3 3 1/3 4 5 6 1. Is this probability distribution bell-shaped? 2. If not, what is the shape of the distribution? 3. Would it be unusual for a randomly chosen value of x to be greater than or equal to 5? Explain. 4. Calculate the mean and standard deviation of this random variable. (Hint: Section 5.1!) Together, Statistics classes will generate more than one hundred sample means from this population. We will then be able to use this sample mean distribution to learn about sampling distributions
Step by Step Solution
There are 3 Steps involved in it

Get step-by-step solutions from verified subject matter experts