

Question: I. Objective of the Assignment This assignment presents a method on how to design a spreadsheet for decision support.The decision model will be Cost-Volume-Profit analysis
I. Objective of the Assignment
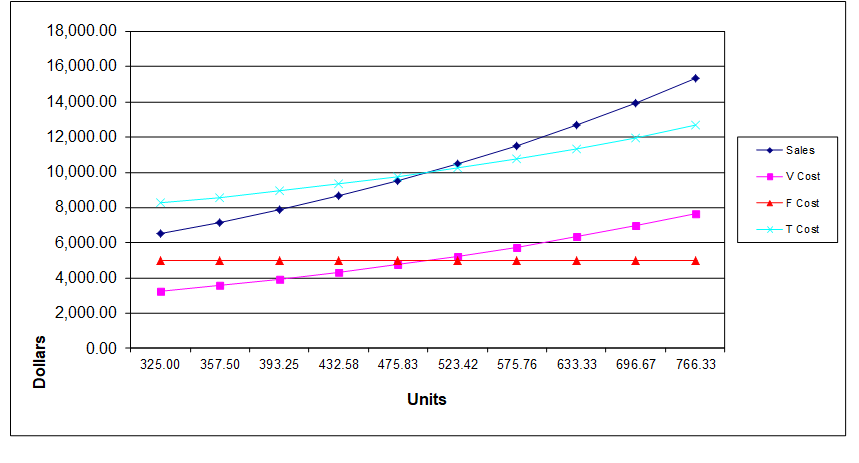
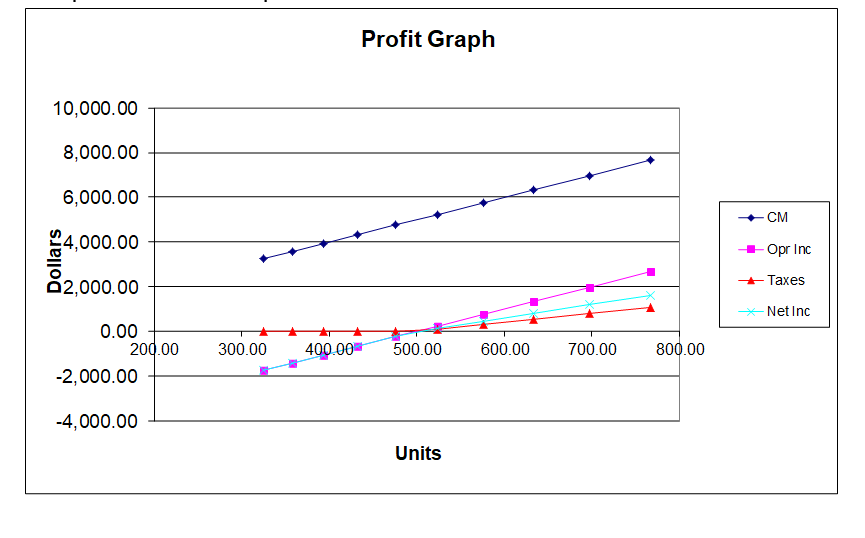
This assignment presents a method on how to design a spreadsheet for decision support.The decision model will be Cost-Volume-Profit analysis using a Contribution Margin Income Statement and two XY graphs (scatter plots).
II. Procedures to Design a Spreadsheet for Decision Making
- Identify the problem and/or decision that need to be supported with analysis.
- Design, formulate or choose a decision model that uses relevant data and information.
- Identify and collect the input data needed by the decision model to solve the problem and/or make the decision. This will require you to make assumptions about the future such as price, quantity, demand, supply, etc...
- Construct the spreadsheet with a data input section and an information output section which will calculate the decision information. Input the data and perform the spreadsheet calculation.
- Review and analyze the information and then make decisions or choices using projections about the future.
- Implement the decision.
- Review and evaluate the results of the decision process.
III. Spreadsheet Functions and Techniques Used in this Exercise
- Cell formatting
- Absolute vs. relative cell addresses
- Input and output sections
- XY graphs (scatter plots)
- Spreadsheet formulas
- If statements
- Sensitivity analysis
- Spin Buttons
IV. Deliverable and Requirements
Your job is to reproduce the following information (contained in the 5 sections) in an Excel spreadsheet. You will submit an Excel Spreadsheet file that includes the five sections contained in the example spreadsheet. Only Section 1 of the spreadsheet will contain input data.Sections 2, 3, 4, and 5 will contain ALL cell formulas or graphs. Therefore, your task is to figure out how to program the spin buttons, spreadsheet cell formulas, and graphs. When the spreadsheet is complete you should be able to change the data in section 1 with the spin control buttons and the changes will be reflected in the output information in sections 2, 3, 4, and 5.
V. Narrative
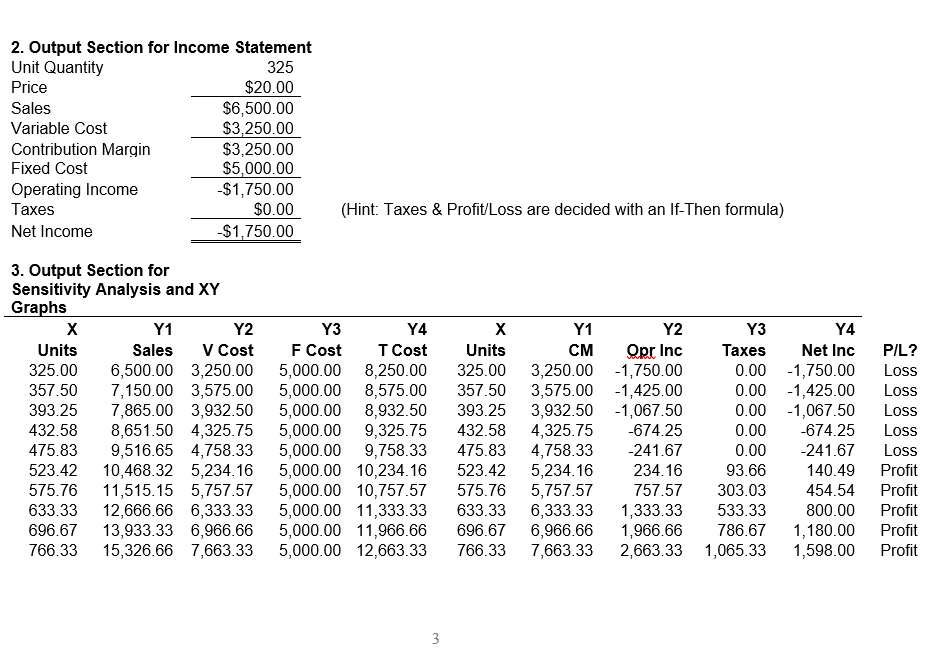
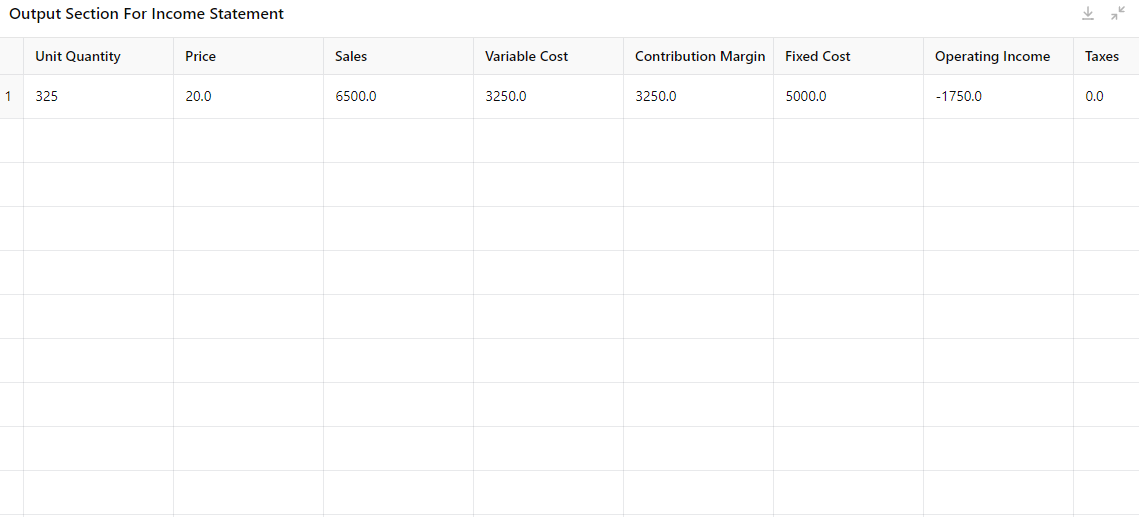
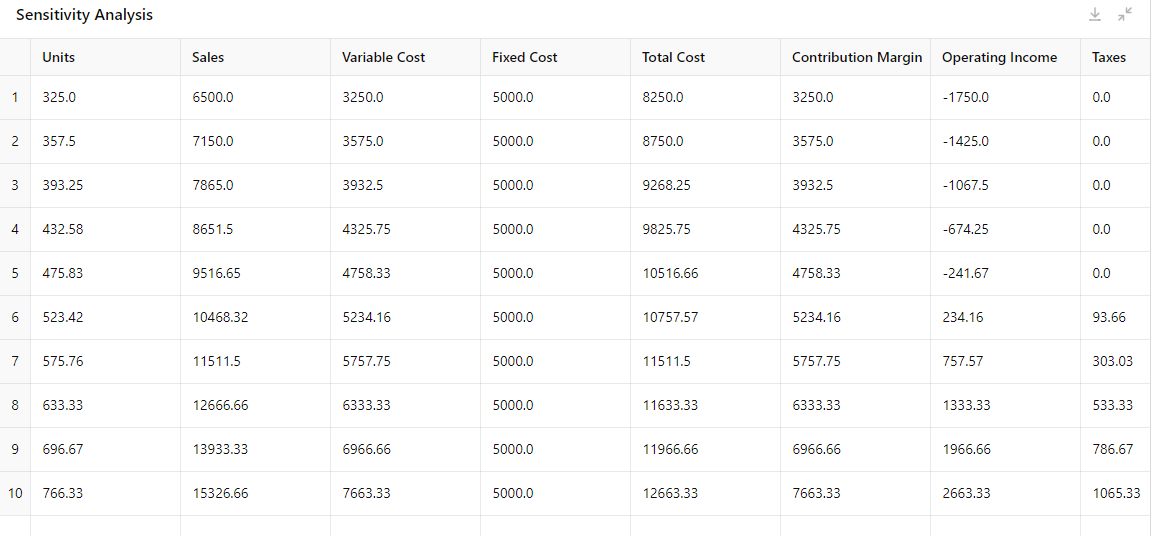
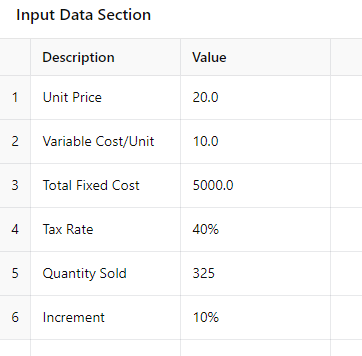
Tom James is starting an online dating service and wants to analyze the Cost-Volume-Profit (CVP) relationships. TJ's Love Connection charges clients $20 for each date arranged.Fixed costs for advertising, computer hardware, software, rent, utilities, furniture, Web site, security, and file back-up are $5,000 per month. Variable costs for entering data and finding a proper match for each client are $10 per date. The total income tax rate is 40%. TJ projects that he will arrange 325 dates for the first month of operations. His relevant operating range is 325 to 766 units (dates) per month which will be analyzed in 10% increments. In section 3 - column 1, the starting unit value of 325 is transferred from the input section and each successive value is incrementally increased. Taxes and Profit/Loss are calculated with an if-then formula. The spin control buttons can increase or decrease the various input variables (see Developer/Insert/Form Controls/Spin Button in Excel).

Step by Step Solution
There are 3 Steps involved in it

Get step-by-step solutions from verified subject matter experts