

Question: I only have 5 mins to answer this and explain Given the 5 categories in the table below, test the claim that the distribution of

I only have 5 mins to answer this and explain
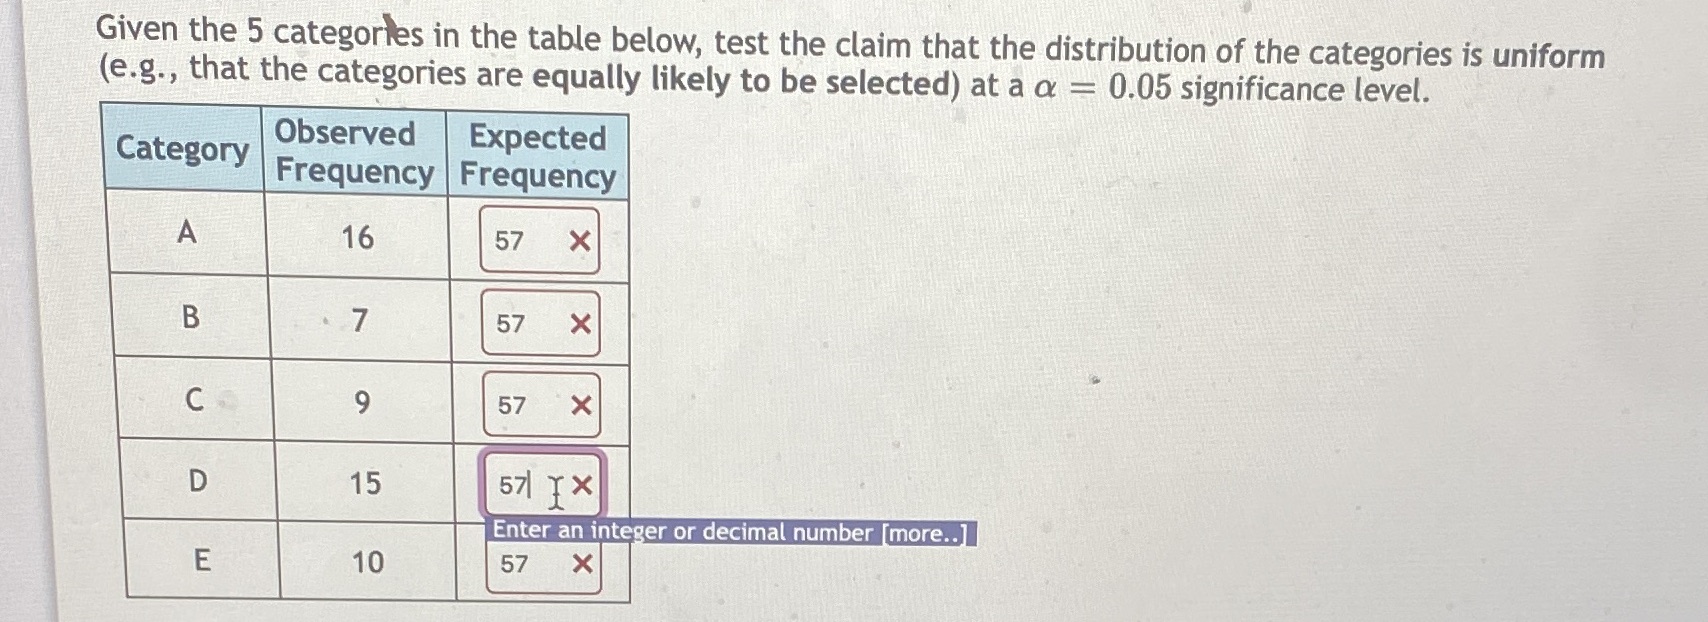
Given the 5 categories in the table below, test the claim that the distribution of the categories is uniform (e.g., that the categories are equally likely to be selected) at a a = 0.05 significance level. Category Observed Expected Frequency Frequency A 16 57 X B 7 57 X C 9 57 X D 15 57 TX Enter an integer or decimal number [more..] E 10 57 X
Step by Step Solution
There are 3 Steps involved in it
1 Expert Approved Answer
Step: 1 Unlock

Question Has Been Solved by an Expert!
Get step-by-step solutions from verified subject matter experts
Step: 2 Unlock
Step: 3 Unlock