

Question: I only have problem with the part D ( I don't understand how to obtain the result for the question.) Part II The following data

I only have problem with the part D ( I don't understand how to obtain the result for the question.)
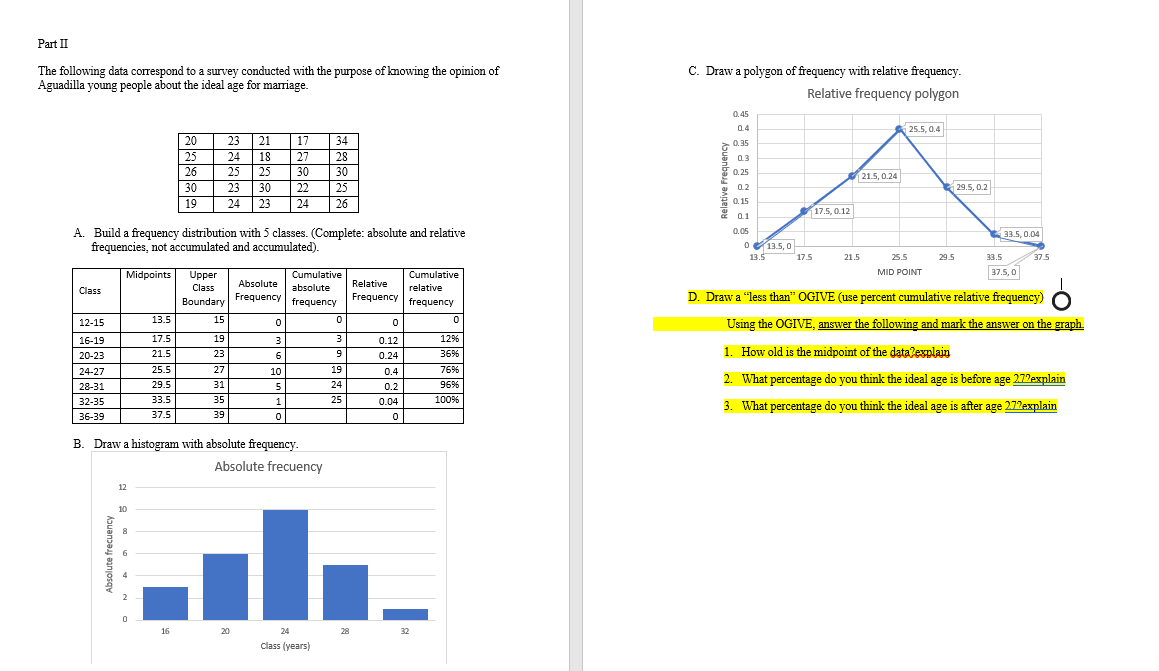
Part II The following data correspond to a survey conducted with the purpose of knowing the opinion of C. Draw a polygon of frequency with relative frequency. Aguadilla young people about the ideal age for marriage Relative frequency polygon 0.45 0.4 25.5, 0.4 20 23 21 17 34 25 24 18 27 28 5 03 26 25 25 30 30 7 0.25 21.5, 0.24 30 23 30 22 25 0.2 29.5, 0.2 19 24 23 24 26 0. 15 0.1 17.5, 0.12 A. Build a frequency distribution with 3 classes. (Complete: absolute and relative 0.05 33.5, 0.04 frequencies, not accumulated and accumulated). DC 135,0 13.5 17.5 21.5 25.5 29.5 33.5 37.5 Midpoints Upper Cumulative Cumulative MID POINT 37.5, 0 Absolute Class Class absolute Relative relative Boundary Frequency frequency Frequency frequency D. Draw a "less than" OGIVE (use percent cumulative relative frequency O 12-15 13. 15 0 0 C Using the OGIVE, answer the following and mark the answer on the graph 16-19 17.5 19 31 3 0.12 129% 20-23 21.5 23 9 D.24 3696 1. How old is the midpoint of the data explain 24-27 25.5 27 10 19 0.4 769% 28-31 29.5 31 5 24 0.2 1696 2. What percentage do you think the ideal age is before age 272explain 32-35 33.5 35 1 25 0.04 1009% 3. What percentage do you think the ideal age is after age 272explain 36-39 37.5 39 O 0 B. Draw a histogram with absolute frequency. Absolute frecuency 12 10 DO Absolute frecuency D 16 20 24 28 32 Class (years)
Step by Step Solution
There are 3 Steps involved in it

Get step-by-step solutions from verified subject matter experts