

Question: I only need help with E and the graph. Please show your work and use the numbers provided. Thanks! Problem 15-6 (algo) The table below
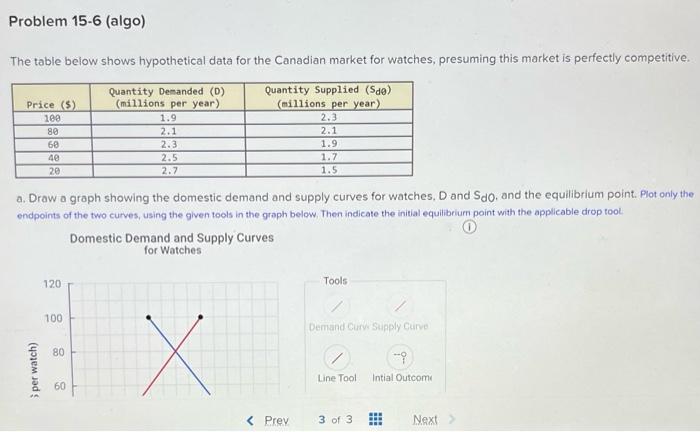
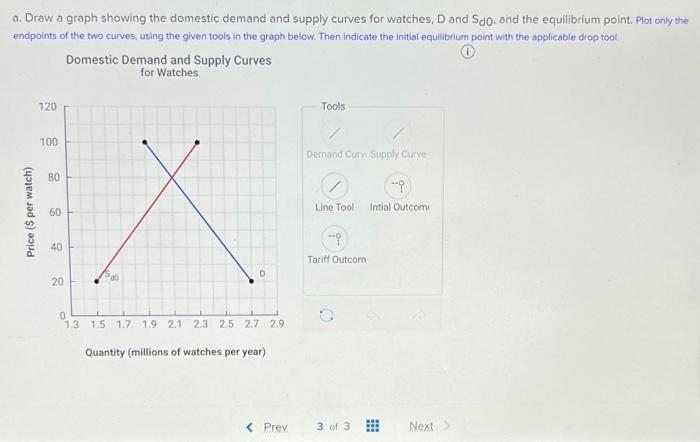
Problem 15-6 (algo) The table below shows hypothetical data for the Canadian market for watches, presuming this market is perfectly competitive. Price (5) 100 80 60 40 20 Quantity Demanded (D) (millions per year) 1.9 2.1 2.3 2.5 2.7 Quantity Supplied (de) (millions per year) 2.3 2.1 1.9 1.7 1.5 a. Draw a graph showing the domestic demand and supply curves for watches, D and Sdo, and the equilibrium point. Plot only the ondpoints of the two curves, using the given tools in the graph below. Then indicate the initial equilibrium point with the applicable drop tool Domestic Demand and Supply Curves for Watches 120 Tools 100 Demand Cur Supply Curve 80 X per watch) *9 Intial Outcome Line Tool 60
Step by Step Solution
There are 3 Steps involved in it

Get step-by-step solutions from verified subject matter experts