

Question: I only need help with question 7 thru 10. Temperature Chirps per Second Temperature Chirps per Second 88.6 20.0 71.6 16.0 93.3 19.8 84.3 18.4
I only need help with question 7 thru 10.
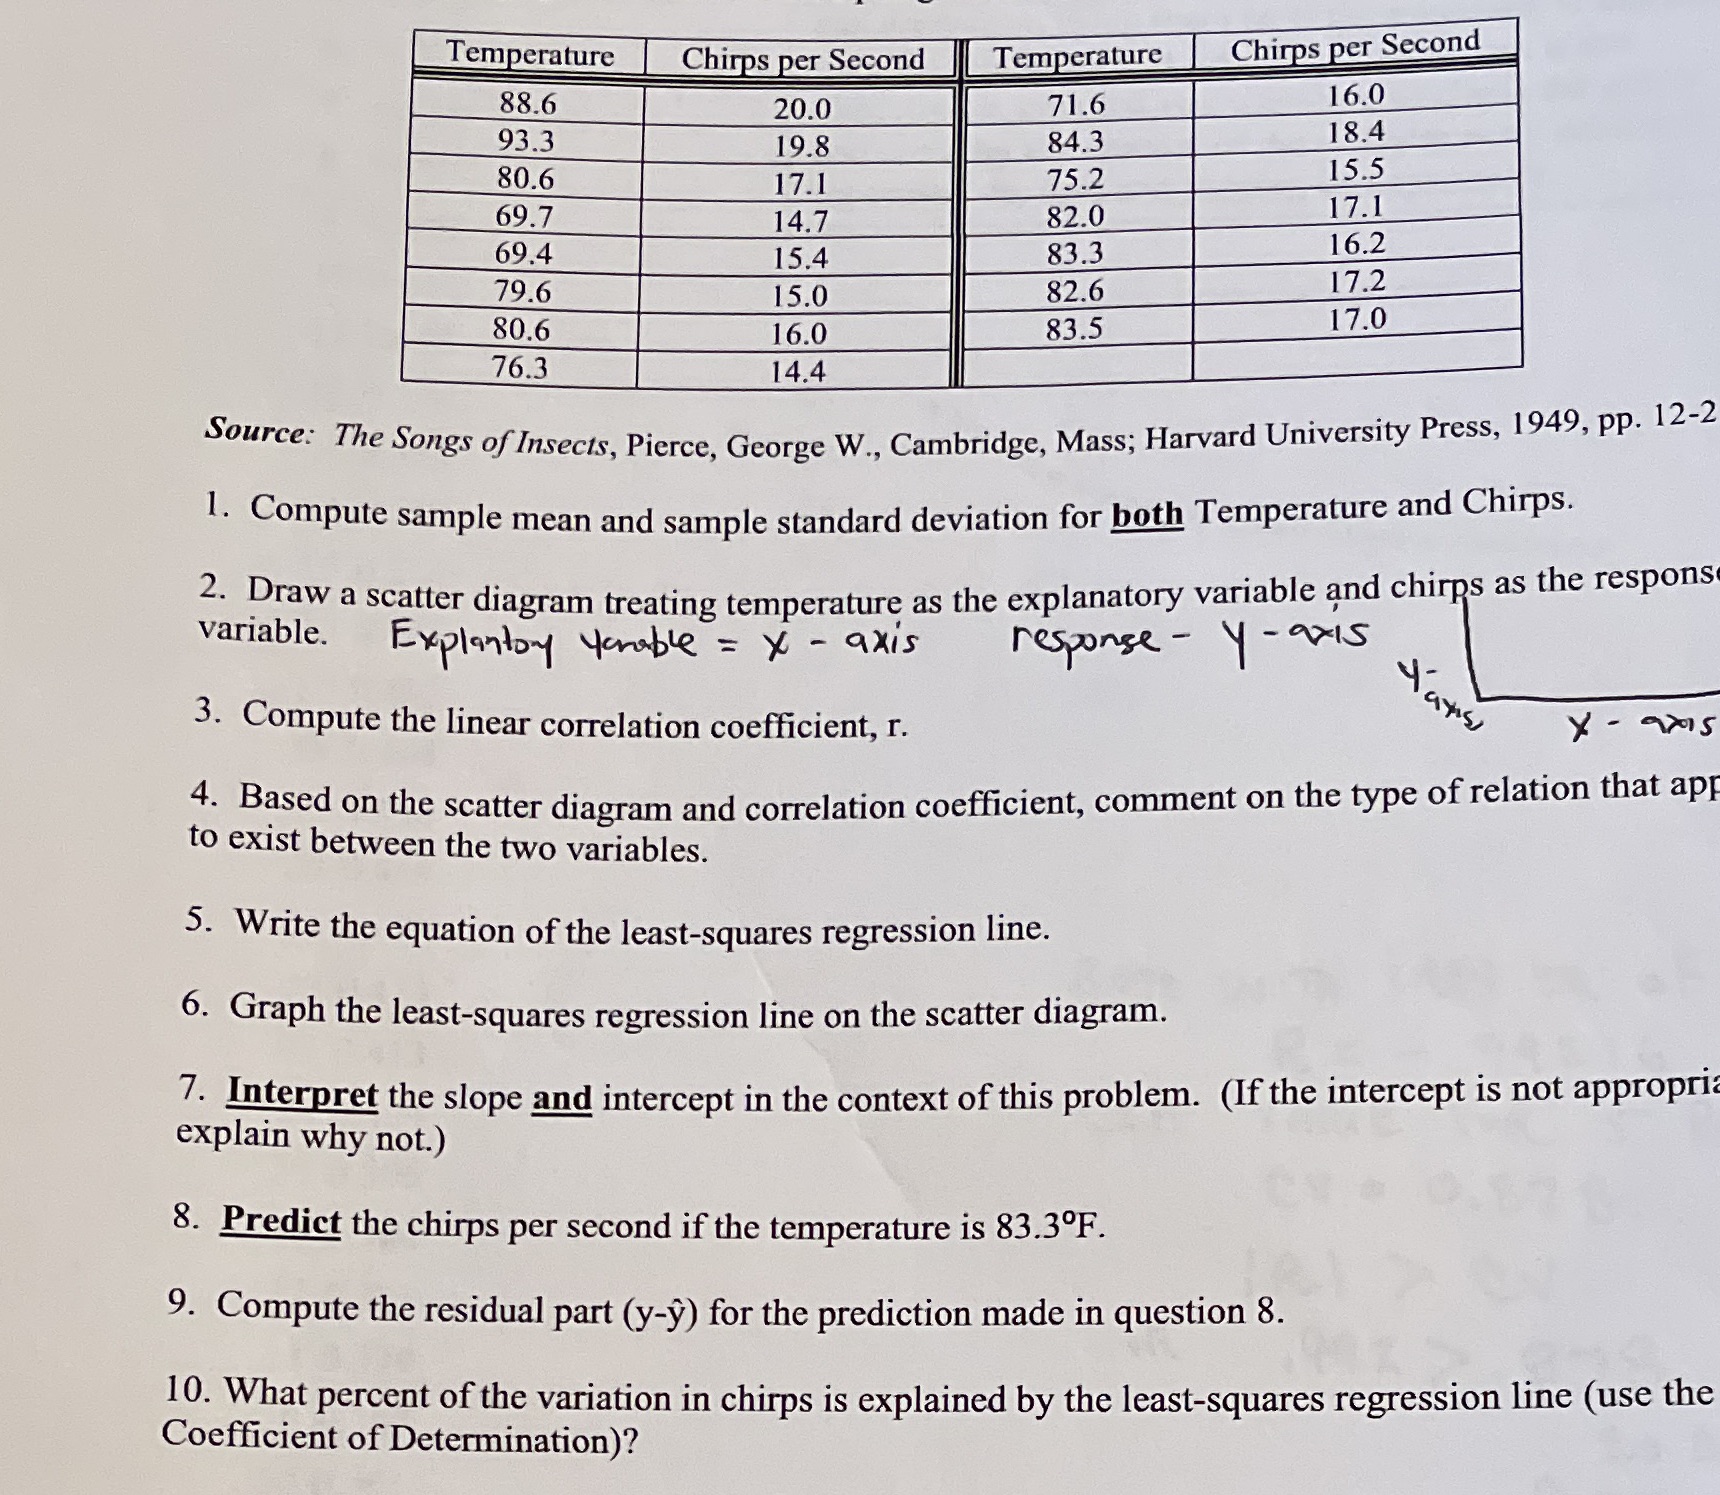
Temperature Chirps per Second Temperature Chirps per Second 88.6 20.0 71.6 16.0 93.3 19.8 84.3 18.4 80.6 17.1 75.2 5.5 69.7 14.7 82.0 17.1 69.4 15.4 83.3 16.2 79.6 15.0 82.6 17.2 80.6 16.0 83.5 17.0 76.3 14.4 Source: The Songs of Insects, Pierce, George W., Cambridge, Mass; Harvard University Press, 1949, pp. 12-2 1. Compute sample mean and sample standard deviation for both Temperature and Chirps. 2. Draw a scatter diagram treating temperature as the explanatory variable and chirps as the respons variable. Explantoy yonable = X - axis response - y-axis 3. Compute the linear correlation coefficient, r. X - axis 4. Based on the scatter diagram and correlation coefficient, comment on the type of relation that app to exist between the two variables. 5. Write the equation of the least-squares regression line. 6. Graph the least-squares regression line on the scatter diagram. 7. Interpret the slope and intercept in the context of this problem. (If the intercept is not appropri explain why not.) 8. Predict the chirps per second if the temperature is 83.30F. 9. Compute the residual part (y-y) for the prediction made in question 8. 10. What percent of the variation in chirps is explained by the least-squares regression line (use the Coefficient of Determination)
Step by Step Solution
There are 3 Steps involved in it

Get step-by-step solutions from verified subject matter experts