

Question: I only need help with section 2a, 2b, and 2c posted in the bottom two pictures; they are the questions with blank blue areas. They
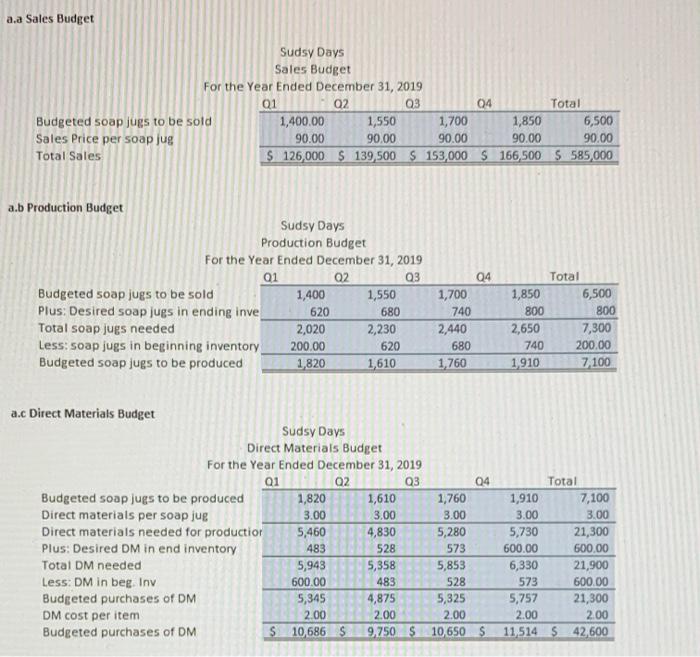
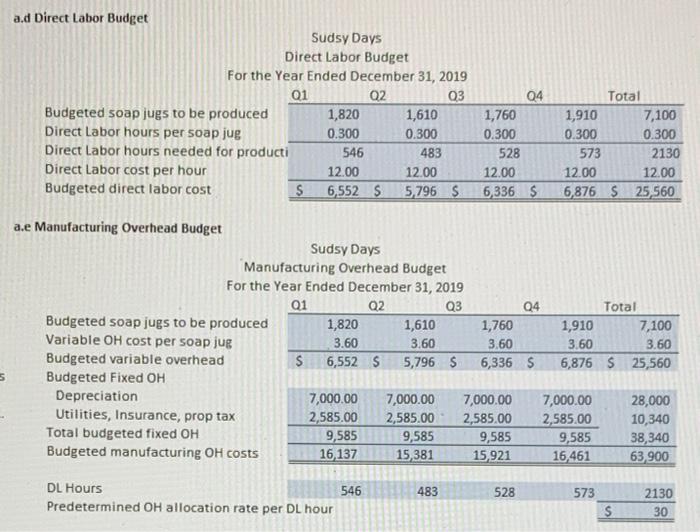
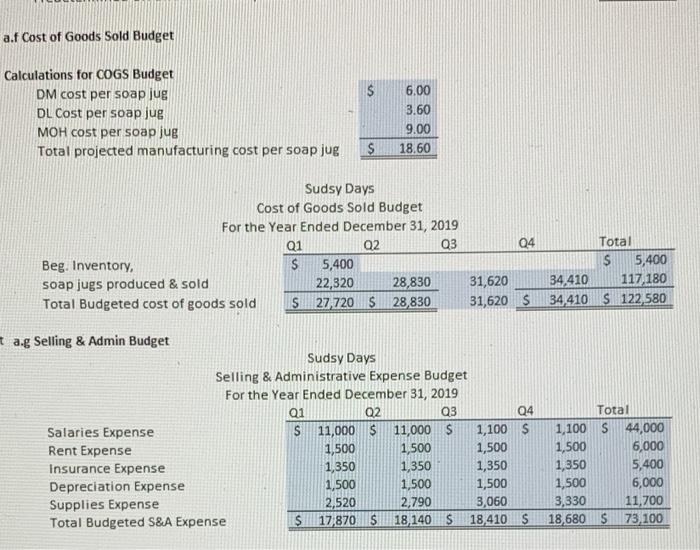
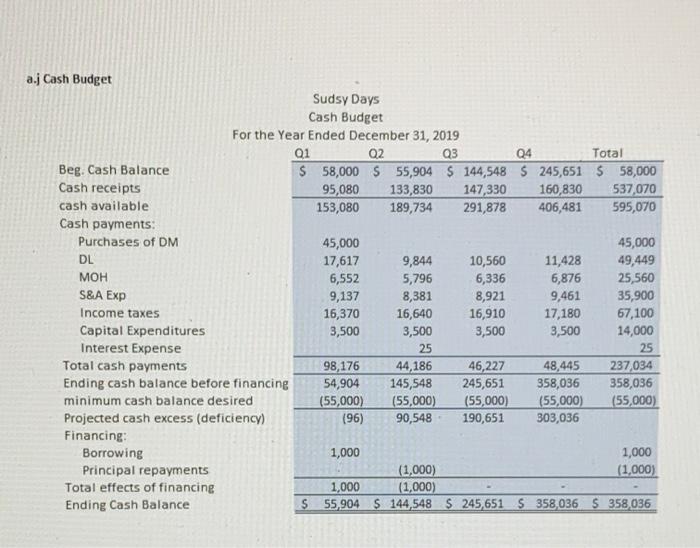
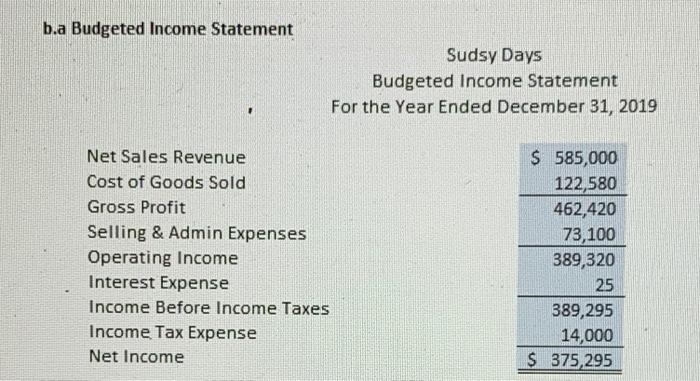
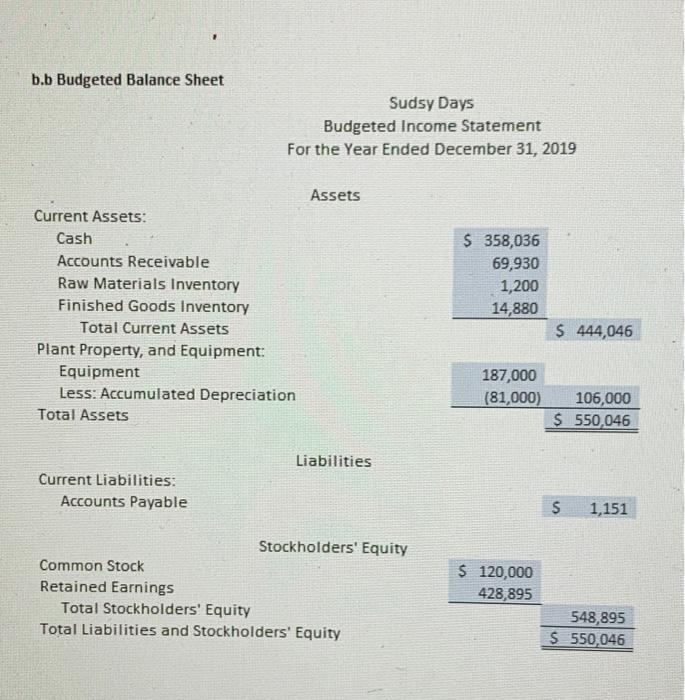
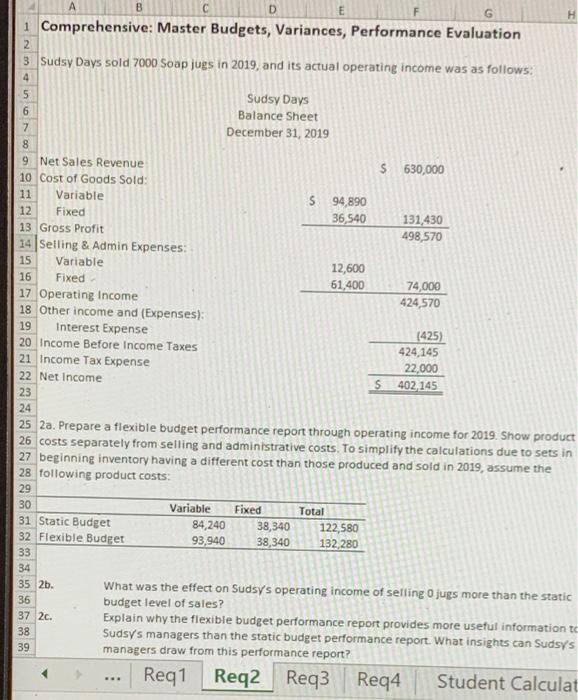
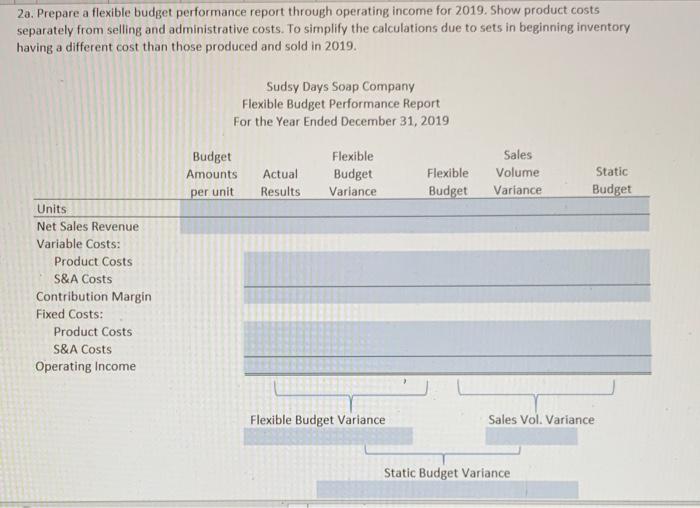
a.a Sales Budget Sudsy Days Sales Budget For the Year Ended December 31, 2019 01 03 04 Total Budgeted soap jugs to be sold 1,400.00 1,550 1,700 1,850 6,500 Sales Price per soap jug 90.00 90.00 90.00 90.00 90.00 Total Sales 126,000 $ 139,500 $ 153,000 $ 166,500 S 585,000 02 a.b Production Budget Sudsy Days Production Budget For the Year Ended December 31, 2019 Q1 02 03 Budgeted soap jugs to be sold 1,400 1,550 Plus: Desired soap jugs in ending inve 620 680 Total soap jugs needed 2,020 2,230 Less: soap jugs in beginning inventory 200.00 620 Budgeted soap jugs to be produced 1,820 1,610 04 1,700 740 2,440 680 1,760 Total 1,850 6,500 800 800 2,650 7,300 740 200.00 1910 7100 04 a.c Direct Materials Budget Sudsy Days Direct Materials Budget For the Year Ended December 31, 2019 Q1 02 Q3 Budgeted soap jugs to be produced 1,820 1,610 Direct materials per soap jug 3.00 3.00 Direct materials needed for production 5,460 4,830 Plus: Desired DM in end inventory 483 528 Total DM needed 5,943 5,358 Less: DM in beg. Inv 600.00 483 Budgeted purchases of DM 5,345 4,875 DM cost per item 2.00 2.00 Budgeted purchases of DM $ 10,686 S 9,250 $ 1,760 3.00 5,280 573 5,853 528 5,325 2.00 10 650 $ Total 1,910 7,100 3.00 3.00 5,730 21,300 600.00 600.00 6,330 21,900 573 600.00 5,757 21,300 2.00 2.00 11,514 5 42,600 a.d Direct Labor Budget Sudsy Days Direct Labor Budget For the Year Ended December 31, 2019 01 02 03 Budgeted soap jugs to be produced 1,820 1,610 Direct Labor hours per soap jug 0.300 0.300 Direct Labor hours needed for producti 546 483 Direct Labor cost per hour 12.00 12.00 Budgeted direct labor cost $ 6,5525 5,796 S 04 1,760 0.300 528 12.00 6,336 5 Total 1,910 7,100 0.300 0.300 573 2130 12.00 12.00 6,876 $ 25,560 a.e Manufacturing Overhead Budget Sudsy Days Manufacturing Overhead Budget For the Year Ended December 31, 2019 Q1 Q2 Q3 Q4 Total Budgeted soap jugs to be produced 1,820 1,610 1,760 1,910 7,100 Variable OH cost per soap jug 3.60 3,60 3.60 3.60 Budgeted variable overhead $ 6,552 5 5,796 5 6,336 5 6,876 S 25,560 5 Budgeted Fixed OH Depreciation 7,000.00 7,000.00 7,000.00 7,000.00 28,000 Utilities, Insurance, prop tax 2,585.00 2,585.00 2,585,00 2,585.00 10,340 Total budgeted fixed OH 9,585 9,585 9,585 9,585 38,340 Budgeted manufacturing OH costs 16 137 15,381 15,921 16,461 63 900 3.60 483 DL Hours 546 Predetermined OH allocation rate per DL hour 528 573 2130 30 $ a.f Cost of Goods Sold Budget Calculations for COGS Budget DM cost per soap jug DL Cost per soap jug MOH cost per soap jug Total projected manufacturing cost per soap jug 6.00 3.60 9.00 18,60 $ Sudsy Days Cost of Goods Sold Budget For the Year Ended December 31, 2019 Q1 Q2 Q3 Beg. Inventory, S 5,400 soap jugs produced & sold 22,320 28,830 Total Budgeted cost of goods sold $ 27, 720 $ 28,830 04 Total S 5,400 34,410 117,180 34,410 S 122,580 31,620 31,620 S ta.g Selling & Admin Budget Sudsy Days Selling & Administrative Expense Budget For the Year Ended December 31, 2019 Q1 Q2 Q3 Q4 Salaries Expense S 11,000 $ 11,000 $ 1,100 $ Rent Expense 1,500 1,500 1,500 Insurance Expense 1,350 1,350 1,350 Depreciation Expense 1,500 1,500 1,500 Supplies Expense 2,520 2,790 3,060 Total Budgeted S&A Expense 17,870 18.140S 18,410 S Total 1,100 S 44,000 1,500 6,000 1,350 5,400 1,500 6,000 3,330 11,700 18,680 S 73 100 a.j Cash Budget Sudsy Days Cash Budget For the Year Ended December 31, 2019 01 02 Q3 04 Total Beg. Cash Balance $ 58,000 $ 55,904 $144,548 5 245,651 $ 58,000 Cash receipts 95,080 133,830 147,330 160,830 537,070 cash available 153,080 189,734 291,878 406,481 595,070 Cash payments: Purchases of DM 45,000 45,000 DL 17,617 9,844 10,560 11,428 49,449 MOH 6,552 5,796 6,336 6,876 25,560 S&A Exp 9,137 8,381 8,921 9,461 35,900 Income taxes 16,370 16,640 16,910 17,180 67,100 Capital Expenditures 3,500 3,500 3,500 3,500 14,000 Interest Expense 25 25 Total cash payments 98,176 44,186 46,227 48,445 237,034 Ending cash balance before financing 54,904 145,548 245,651 358,036 358,036 minimum cash balance desired (55,000) (55,000) (55,000) (55,000) (55,000) Projected cash excess (deficiency) 196) 90,548 190,651 303,036 Financing Borrowing 1,000 1,000 Principal repayments (1,000) (1,000) Total effects of financing 1,000 (1,000) Ending Cash Balance $ 55,904 $144,548 $ 245,651 $ 358,036 S 358,036 b.a Budgeted Income Statement Sudsy Days Budgeted Income Statement For the Year Ended December 31, 2019 Net Sales Revenue Cost of Goods Sold Gross Profit Selling & Admin Expenses Operating Income Interest Expense Income Before Income Taxes Income Tax Expense Net Income $ 585,000 122,580 462,420 73,100 389,320 25 389,295 14,000 S 375,295 b.b Budgeted Balance Sheet Sudsy Days Budgeted Income Statement For the Year Ended December 31, 2019 Assets Current Assets: Cash Accounts Receivable Raw Materials Inventory Finished Goods Inventory Total Current Assets Plant Property, and Equipment: Equipment Less: Accumulated Depreciation Total Assets $ 358,036 69,930 1,200 14,880 S 444,046 187,000 (81,000) 106,000 $ 550,046 Liabilities Current Liabilities: Accounts Payable $ 1,151 Stockholders' Equity Common Stock Retained Earnings Total Stockholders' Equity Total Liabilities and Stockholders' Equity $ 120,000 428,895 548,895 S 550,046 4 5 6 D E G 1 Comprehensive: Master Budgets, Variances, Performance Evaluation 2 3. Sudsy Days sold 7000 Soap jugs in 2019, and its actual operating income was as follows: Sudsy Days Balance Sheet 7 December 31, 2019 8 9 Net Sales Revenue $630,000 10 Cost of Goods Sold: 11 Variable S 94,890 12 Fixed 36,540 131,430 13 Gross Profit 498,570 14 Seiling & Admin Expenses: 15 Variable 12,600 16 Fixed 61,400 74,000 17 Operating Income 424,570 18 Other income and (Expenses): 19 Interest Expense (425) 20 Income Before Income Taxes 424,145 21 Income Tax Expense 22,000 22 Net Income S 402 145 23 24 25 2a. Prepare a flexible budget performance report through operating income for 2019. Show product 26 costs separately from selling and administrative costs to simplify the calculations due to sets in 27 beginning inventory having a different cost than those produced and sold in 2019, assume the 28 following product costs: 29 30 Variable Fixed Total 31 Static Budget 84,240 38,340 122,580 32 Flexible Budget 93,940 38,340 132,280 33 34 35 2b. What was the effect on Sudsy's operating income of selling O jugs more than the static 36 budget level of sales? 37 2c. Explain why the flexible budget performance report provides more useful information to 38 Sudsy's managers than the static budget performance report. What insights can Sudsy's managers draw from this performance report? Req1 Req2 Req3 Req4 Student Calculat 39 . 2a. Prepare a flexible budget performance report through operating income for 2019. Show product costs separately from selling and administrative costs. To simplify the calculations due to sets in beginning inventory having a different cost than those produced and sold in 2019. Sudsy Days Soap Company Flexible Budget Performance Report For the Year Ended December 31, 2019 Budget Amounts Actual Results Flexible Budget Variance Flexible Budget Sales Volume Variance Static Budget per unit Units Net Sales Revenue Variable Costs: Product Costs S&A Costs Contribution Margin Fixed Costs: Product Costs S&A Costs Operating Income Flexible Budget Variance Sales Vol. Variance Static Budget Variance 2b. What was the effect on Sudsy's operating income of selling O jugs more than the static budget level of sales? 2c. Explain why the flexible budget performance report provides more useful information to Sudsy's managers than the static budget performance report. What insights can Sudsy's managers draw from this performance report
Step by Step Solution
There are 3 Steps involved in it

Get step-by-step solutions from verified subject matter experts