

Question: I only need problems 5 and 6. This is my work for questions 1 -4. Excel Assignment # 6 - Performance Measurement The following standard
I only need problems 5 and 6. This is my work for questions 1 -4.
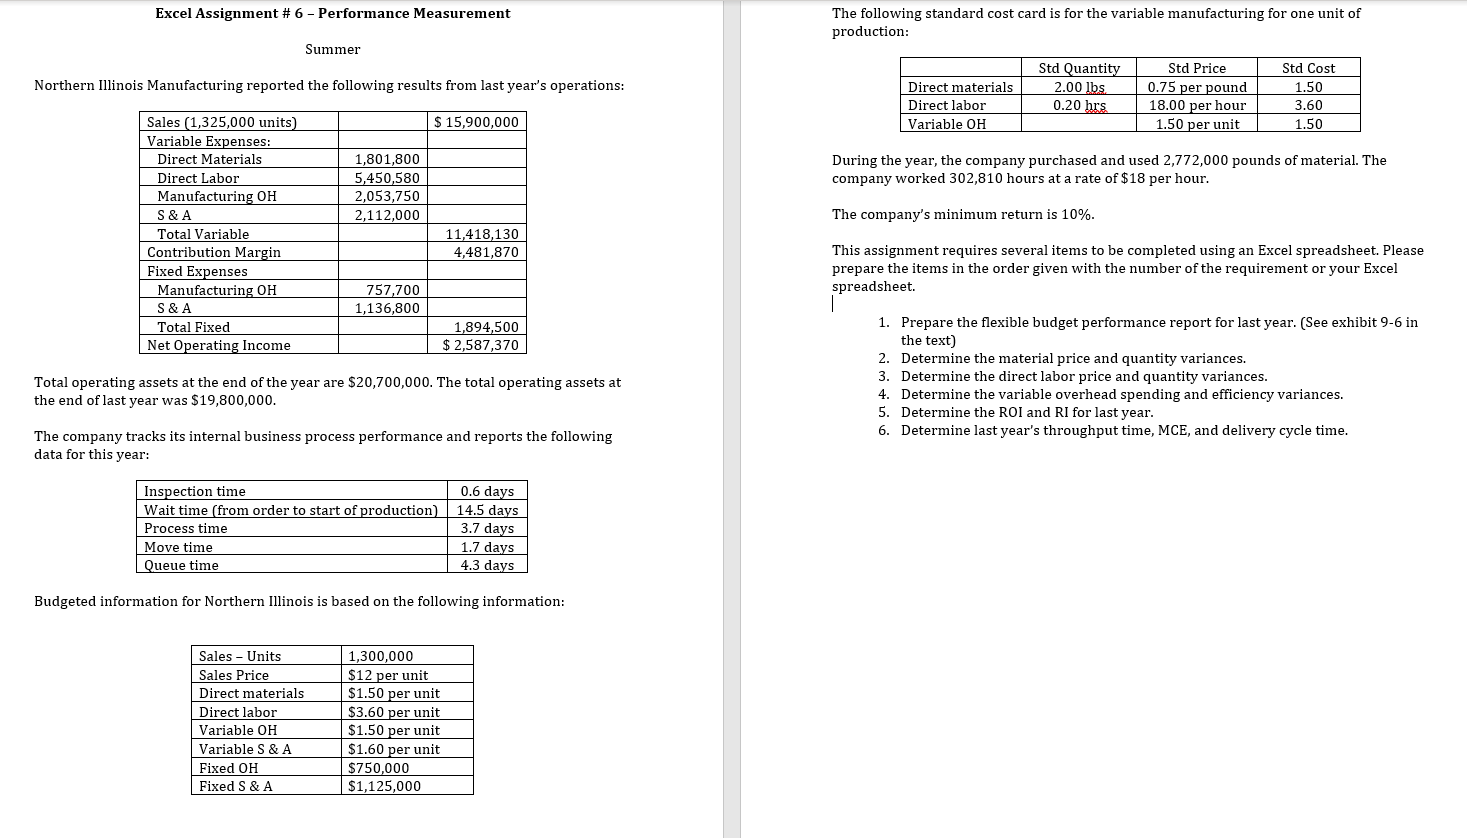
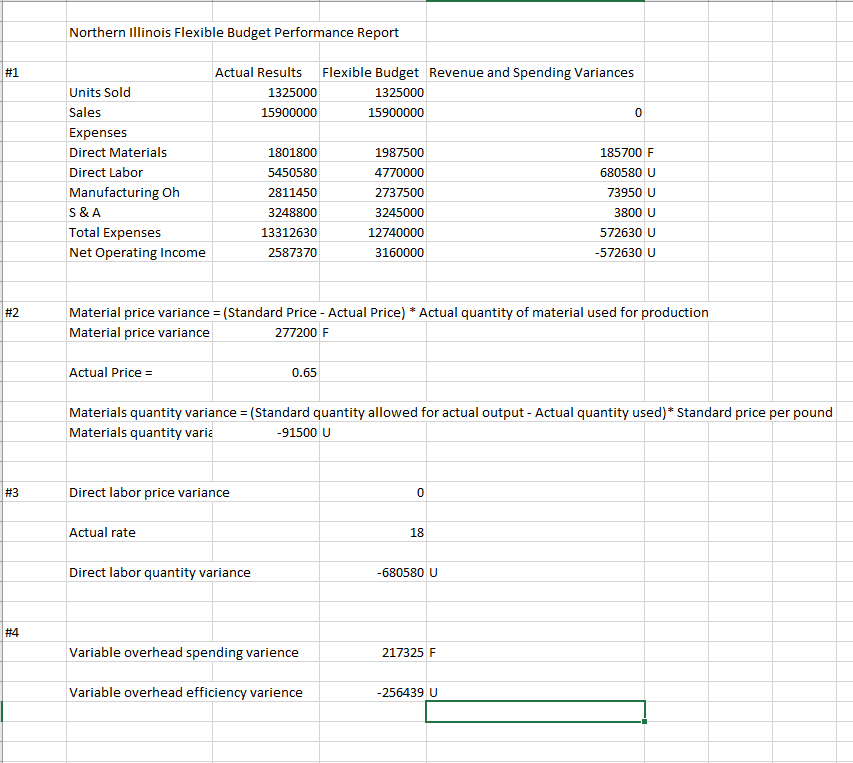
Excel Assignment # 6 - Performance Measurement The following standard cost card is for the variable manufacturing for one unit of production: Summer Northern Illinois Manufacturing reported the following results from last year's operations: Direct materials Direct labor Variable OH Std Quantity 2.00 lbs 0.20 hrs Std Price 0.75 per pound 18.00 per hour 1.50 per unit Std Cost 1.50 3.60 1.50 $ 15,900,000 1,801,800 5,450,580 2,053,750 2,112,000 During the year, the company purchased and used 2,772,000 pounds of material. The company worked 302,810 hours at a rate of $18 per hour. The company's minimum return is 10%. Sales (1,325,000 units) Variable Expenses: Direct Materials Direct Labor Manufacturing OH S&A Total Variable Contribution Margin Fixed Expenses Manufacturing OH S&A Total Fixed Net Operating Income 11,418,130 4,481,870 This assignment requires several items to be completed using an Excel spreadsheet. Please prepare the items in the order given with the number of the requirement or your Excel spreadsheet. 757,700 1,136,800 1,894,500 $ 2,587,370 Total operating assets at the end of the year are $20,700,000. The total operating assets at the end of last year was $19,800,000. 1. Prepare the flexible budget performance report for last year. (See exhibit 9-6 in the text) 2. Determine the material price and quantity variances. 3. Determine the direct labor price and quantity variances. 4. Determine the variable overhead spending and efficiency variances. 5. Determine the ROI and RI for last year. 6. Determine last year's throughput time, MCE, and delivery cycle time. The company tracks its internal business process performance and reports the following data for this year: Inspection time Wait time (from order to start of production) Process time Move time Queue time 0.6 days 14.5 days 3.7 days 1.7 days 4.3 days Budgeted information for Northern Illinois is based on the following information: Sales - Units Sales Price Direct materials Direct labor Variable OH Variable S & A Fixed OH Fixed S & A 1,300,000 $12 per unit $1.50 per unit $3.60 per unit $1.50 per unit $1.60 per unit $750,000 $1,125,000 Northern Illinois Flexible Budget Performance Report #1 Actual Results Flexible Budget Revenue and Spending Variances Units Sold 1325000 1325000 Sales 15900000 15900000 Expenses Direct Materials 1801800 1987500 185700 F Direct Labor 5450580 4770000 680580 U Manufacturing Oh 2811450 2737500 73950 V S&A 3248800 3245000 3800 U Total Expenses 13312630 12740000 572630 U Net Operating Income 2587370 3160000 -572630 U #2 Material price variance = (Standard Price - Actual Price) * Actual quantity of material used for production Material price variance 277200 F Actual Price = 0.65 Materials quantity variance = (Standard quantity allowed for actual output - Actual quantity used)* Standard price per pound Materials quantity varia -91500 U #3 Direct labor price variance 0 Actual rate 18 Direct labor quantity variance -680580 U #4 Variable overhead spending varience 217325 F Variable overhead efficiency varience -256439 U
Step by Step Solution
There are 3 Steps involved in it

Get step-by-step solutions from verified subject matter experts