

Question: I ONLY NEED QUESTION 9 SOLUTION I ONLY NEED QUESTION 9 SOLUTION I ONLY NEED QUESTION 9 SOLUTION I ONLY NEED QUESTION 9 SOLUTION I
I ONLY NEED QUESTION 9 SOLUTION
I ONLY NEED QUESTION 9 SOLUTION
I ONLY NEED QUESTION 9 SOLUTION
I ONLY NEED QUESTION 9 SOLUTION
I ONLY NEED QUESTION 9 SOLUTION
I DONT NEED QUESTION 6
I ONLY NEED QUESTION 9 SOLUTION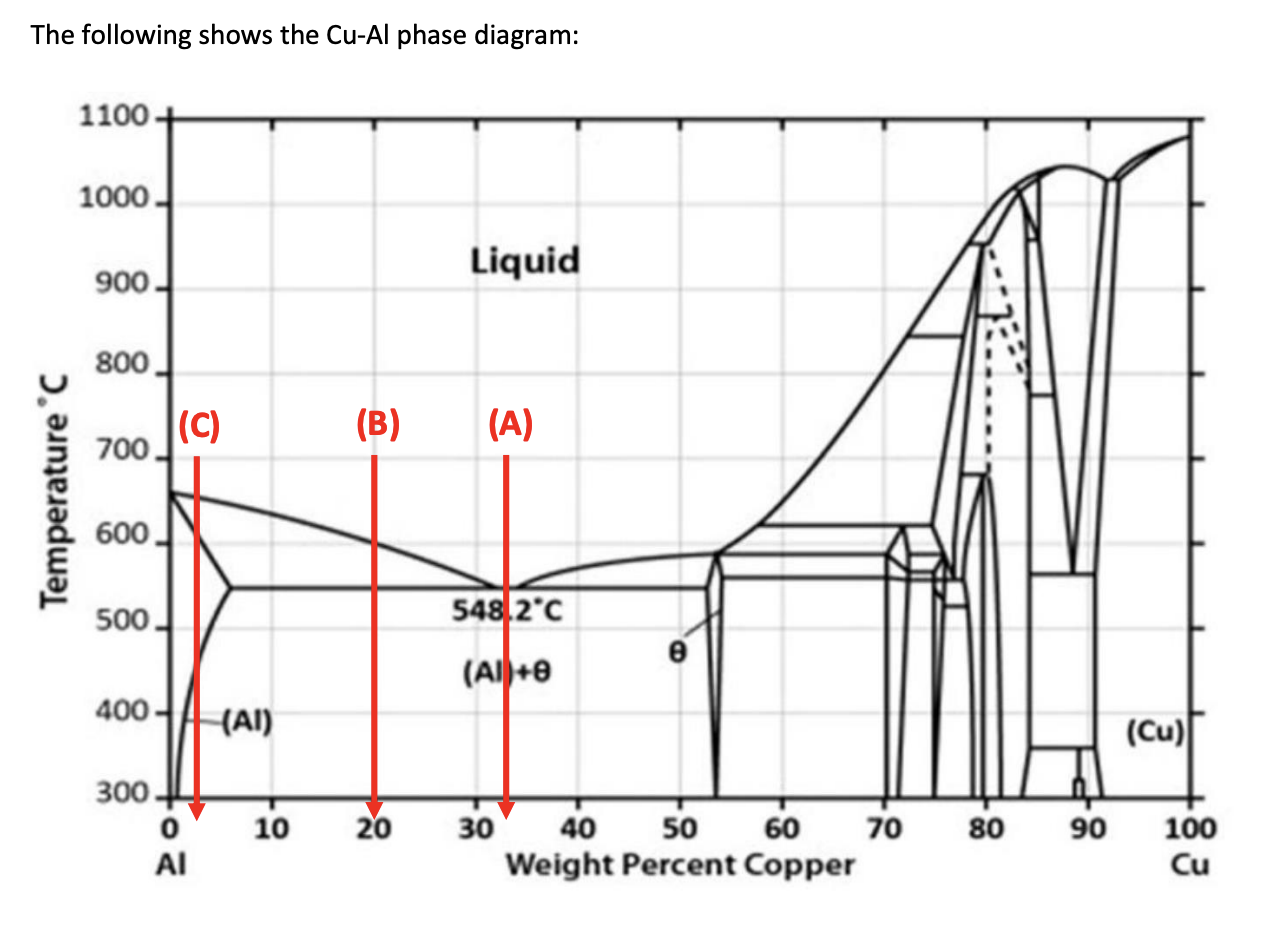
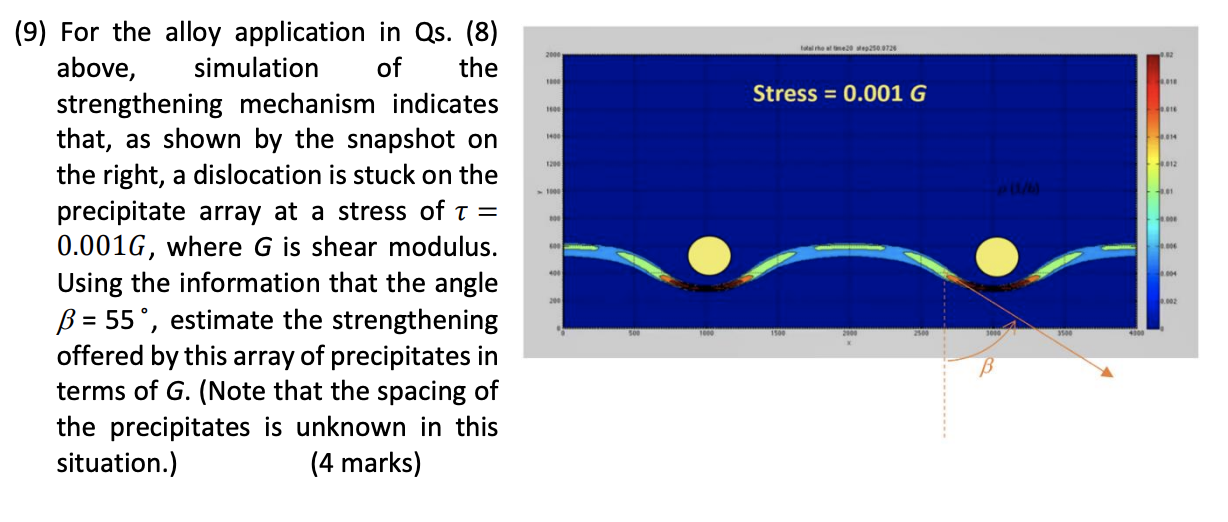
The following shows the Cu-Al phase diagram: 1100 1000 Liquid 900 800 (C) (B) (A) 700 Temperature 600 500. 548.2C 0 (AI)+ 400 (AI) (Cu) - 300 0 10 20 30 40 50 70 Weight Percent Copper 60 80 90 100 Cu Hotel ro20250.0726 2000 12 1000 2010 Stress = 0.001 G 1800 2018 1200 2012 1000 081 00 10000 (9) For the alloy application in Qs. (8) above, simulation of the strengthening mechanism indicates that, as shown by the snapshot on the right, a dislocation is stuck on the precipitate array at a stress of t = 0.0016, where G is shear modulus. Using the information that the angle B = 55, estimate the strengthening offered by this array of precipitates in terms of G. (Note that the spacing of the precipitates is unknown in this situation.) (4 marks) 06 404 004 200 2002 so 100 1500 3000 200 3000 100 (7) An alloy containing 3 wt. % Cu is first melted at 700C, and then slowly cooled down as shown by process (C) in the phase diagram. Describe as fully as you can the microstructural changes of the alloy during the cooling process. Illustrate the changes by sketches of the microstructure at different stages of the cooling. (6 marks) (8) What is the traditional application of the Al-3 wt.%Cu alloy in Qs. (7) above? Explain why the slow cooling of (C) in Qs. (7) is not ideal for the optimized strength of this application of the alloy. Then, describe as fully as possible the suitable process for achieving the optimized strength. (10 marks)
Step by Step Solution
There are 3 Steps involved in it

Get step-by-step solutions from verified subject matter experts