

Question: I only need the answer for Question 7 Use the Excel Template and the table of prices and dividends below to answer the next seven
 I only need the answer for Question 7
Use the Excel Template and the table of prices and dividends below to answer the next seven questions:
| Nike, Inc. Ticker = NKE | S&P 500 | ||
| Month | Price | Dividend | Price |
| Dec-16 | 50.65 | 0.18 | 2191.08 |
| Nov-16 | 50.07 | 2198.81 | |
| Oct-16 | 50.18 | 2126.15 | |
| Sep-16 | 52.65 | 0.16 | 2168.27 |
| Aug-16 | 57.64 | 2170.95 | |
| Jul-16 | 55.5 | 2173.6 | |
| Jun-16 | 55.2 | 0.16 | 2098.86 |
| May-16 | 55.22 | 2096.95 | |
| Apr-16 | 58.94 | 2065.3 | |
| Mar-16 | 61.47 | 0.16 | 2059.74 |
| Feb-16 | 61.59 | 1932.23 | |
| Jan-16 | 62.01 | 1940.24 | |
| Dec-15 | 62.5 | 0.16 | 2043.94 |
| Nov-15 | 66.14 | 2080.41 | |
| Oct-15 | 65.515 | 2079.36 | |
| Sep-15 | 61.485 | 0.14 | 1920.03 |
| Aug-15 | 55.875 | 1972.18 | |
| Jul-15 | 57.61 | 2103.84 | |
| Jun-15 | 54.01 | 2063.11 | |
| May-15 | 50.835 | 0.14 | 2107.39 |
| Apr-15 | 49.42 | 2085.51 | |
| Mar-15 | 50.165 | 2067.89 | |
| Feb-15 | 48.56 | 0.14 | 2104.5 |
| Jan-15 | 46.125 | 1994.99 | |
| Dec-14 | 48.075 | 0.14 | 2058.9 |
| Nov-14 | 49.645 | 2067.56 | |
NOTE: The most recent price is on the first row of the table.
1. (EXCEL TEMPLATE) Calculate monthly returns for Nike, Inc. (NKE) and the S&P 500. Be sure to include the dividends for Nike in the return.
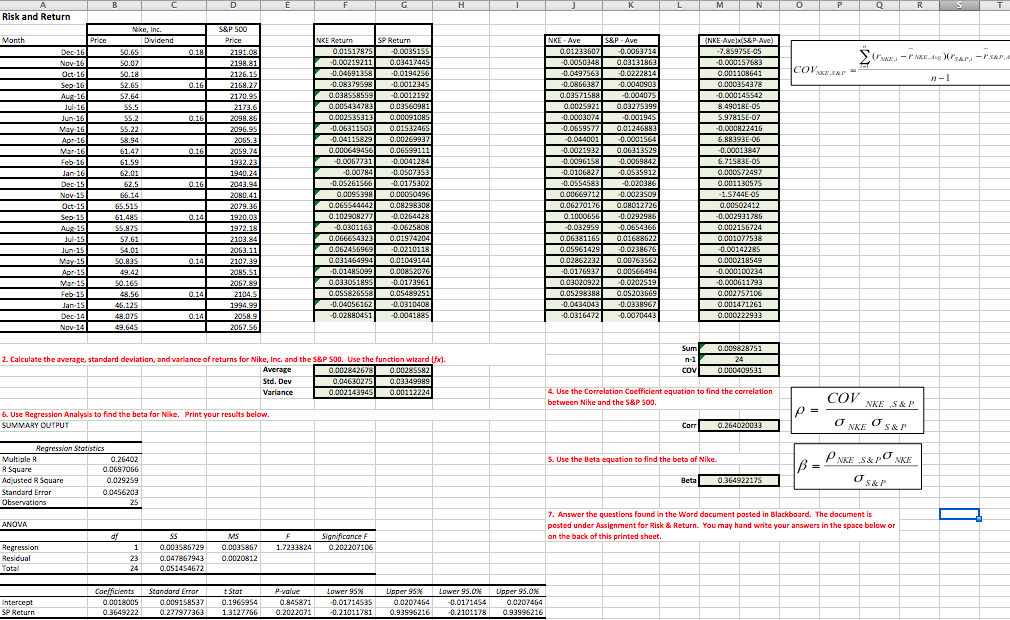
2. (EXCEL TEMPLATE) Calculate the average, standard deviation, and variance of returns for Nike, Inc. and the S&P 500.
3. (EXCEL TEMPLATE) Use the covariance equation to find the covariance between Nike, Inc. and the S&P 500.
4. (EXCEL TEMPLATE) Use the correlation coefficient equation to find the correlation coefficient between Nike, Inc. and the S&P 500.
5. (EXCEL TEMPLATE) Use the beta equation to find the beta of Nike, Inc.
6. (EXCEL TEMPLATE) Use Regression Analysis to find the beta for Nike, Inc. (you should get the same answer as in question 5).
------------------------------------------------------------------------------------------------------------------------------------------------------
------------------------------------------------------------------------------------------------------------------------------------------------------
( I only need the answer for Question 7 )
7. Answer the following concept questions:
a. Go to the website for Yahoo Finance and find the Company Profile for Nike, Inc. What Industry and Sector is listed for Nike, Inc.?
b. Given the industry and sector, does the value of the beta for Nike, Inc. that you calculated seem too high/low? Explain.
c. What is the probability that the true beta for Nike, Inc. is equal to zero?
d. Does the R2 for Nike, Inc. seem reasonable? Explain.
e. If the market risk premium is 5% and the risk free rate is 1%, what return would you expect to earn on Nike, Inc.?
Risk and Return NKE Ave S&P Ave 40.0050343 0.03131363 COVA 40.0491363 -0.0222814 6159 1932.23 0.05561429 -0,023H676 40.0176537 0.00562434 0.03020322 -0.0202513 40.04056152 40.0310405 40.0434043 -0,033 2. C ndard deviation, d varial for Ni &P50 Us ion coefficient equati COV S&P 500 NNE ,S&P 6. Us Regress Analysis to find the beta for Nike. P ults bel SUMMARY OUT PUT corrl 0.204020002134 NKE S&P Multiple R 0.20402 s. Use the Beta equation to find the beta of Nike. NATE S&P S&P 7. An d in Word do nt posted Blackboard. The do posted Assig Risk & Retu nd write yo the space be the back of this printed sheet. Regression 1 I0.003s86 29 0003s867 1.233824 2002.201106
Step by Step Solution
There are 3 Steps involved in it

Get step-by-step solutions from verified subject matter experts