

Question: I only need the Excel part Solve in Excel and MatLab. Each solution is worth 1 0 points for a total of 2 0 points
I only need the Excel part
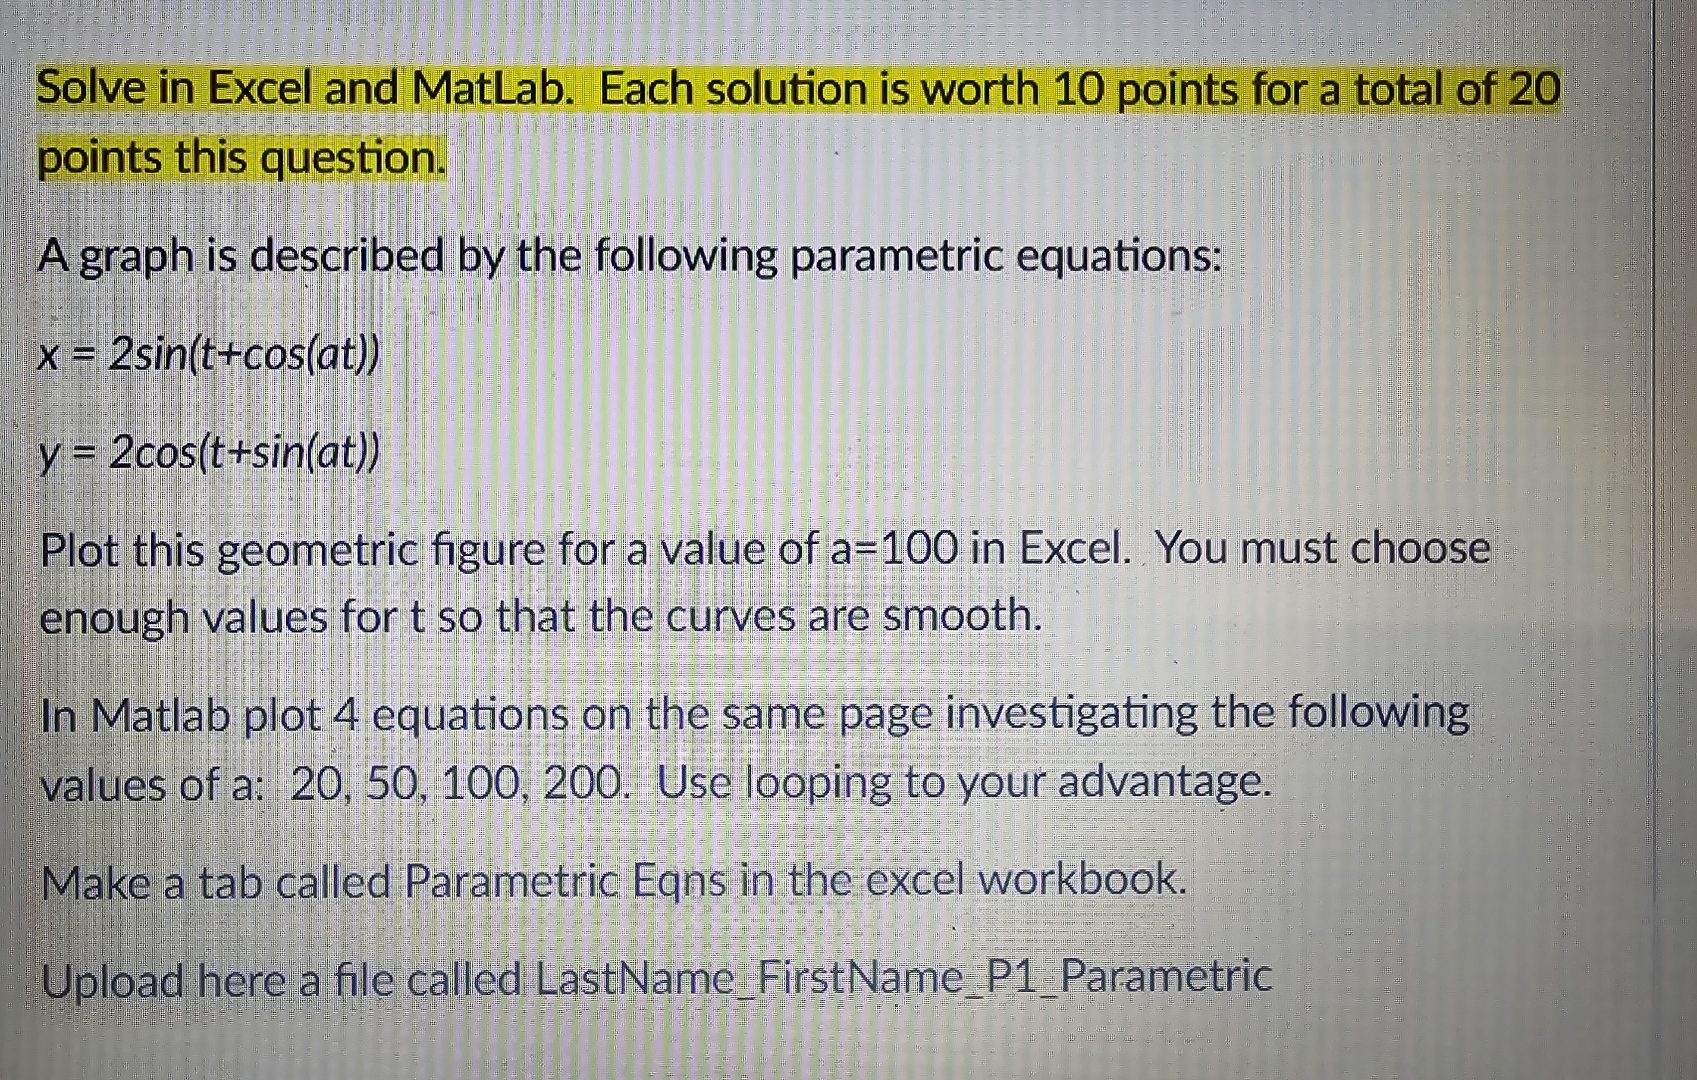
Solve in Excel and MatLab. Each solution is worth points for a total of points this question.
A graph is described by the following parametric equations:
Plot this geometric figure for a value of in Excel. You must choose enough values for so that the curves are smooth.
In Matlab plot equations on the same page investigating the following values of a: Use looping to your advantage.
Make a tab called Parametric Eqns in the excel workbook.
Upload here a file called LastName FirstNamePParametric
Step by Step Solution
There are 3 Steps involved in it
1 Expert Approved Answer
Step: 1 Unlock

Question Has Been Solved by an Expert!
Get step-by-step solutions from verified subject matter experts
Step: 2 Unlock
Step: 3 Unlock