

Question: I only received partial credit for this question. Question 2 The table below shows the life expectancy for an individual born in the United States
I only received partial credit for this question.
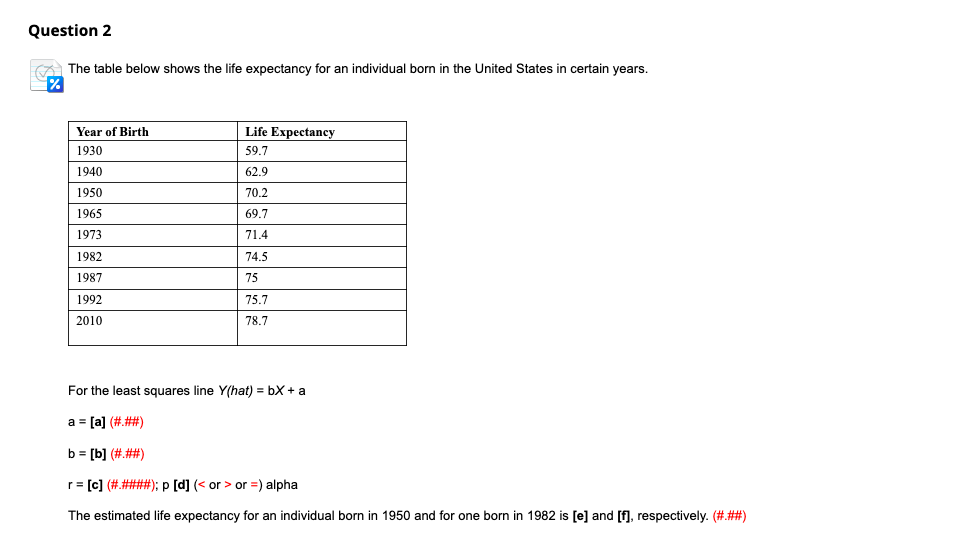
Question 2 The table below shows the life expectancy for an individual born in the United States in certain years. Year of Birth Life Expectancy 1930 59.7 1940 62.9 1950 70.2 1965 69.7 1973 71.4 1982 74.5 1987 75 1992 75.7 2010 78.7 For the least squares line Y(hat) = bX + a a = [a] (#.##) b = [b] (#.##) r = [c] (#.####); p [d] ( or =) alpha The estimated life expectancy for an individual born in 1950 and for one born in 1982 is [e] and [f], respectively. (#.##)
Step by Step Solution
There are 3 Steps involved in it
1 Expert Approved Answer
Step: 1 Unlock

Question Has Been Solved by an Expert!
Get step-by-step solutions from verified subject matter experts
Step: 2 Unlock
Step: 3 Unlock