

Question: I. Plot a histogram of the data using Excel and MAILAB Compute the follbwing statistics of the given data using Excel and MATLAB 2. Mean
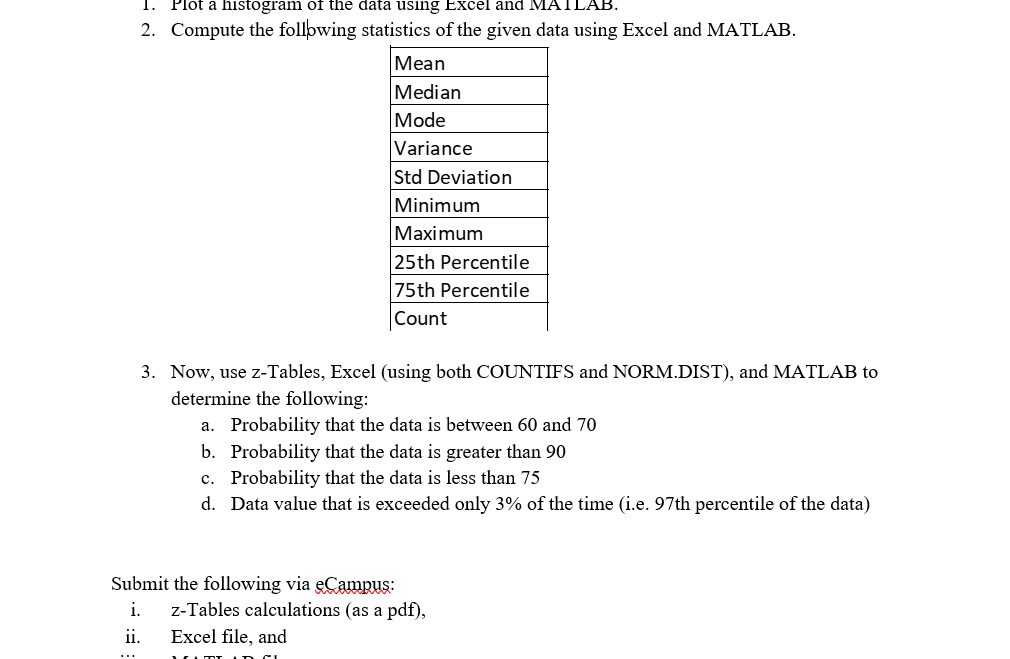
I. Plot a histogram of the data using Excel and MAILAB Compute the follbwing statistics of the given data using Excel and MATLAB 2. Mean Median Mode Variance Std Deviation Minimum Maximum 25th Percentile 75th Percentile Count 3. Now, use z-Tables, Excel (using both COUNTIFS and NORM.DIST), and MATLAB to determine the following a. b. c. d. Probability that the data is between 60 and 70 Probability that the data is greater than 90 Probability that the data is less than 75 Data value that is exceeded only 3% of the time (ie, 97th percentile of the data) Submit the following via eCampus i. z-Tables calculations (as a pdf), ii. Excel file, and
Step by Step Solution
There are 3 Steps involved in it

Get step-by-step solutions from verified subject matter experts