

Question: I post all information on this question, and if there is more information need to be answered, I don't have it either. Common-sized balance sheets
I post all information on this question, and if there is more information need to be answered, I don't have it either.
Common-sized balance sheets (all items scaled by total assets), common-sized income statements (all items scaled by net sales), and selected financial ratios for the nine companies are provided. Since unusual deviation from target values may occur in any given year, the values for the items were averaged over three years. The three- year average common-sized balance sheet, common-sized income statement, and financial ratios are reported in Exhibits 2, 3, and 4, respectively.
The 9 companies are drawn from the following 9 different industries:
Liquor producer and distributor
Discount airline
Commercial bank (items fitted into the same categories as the non-financial firms)
Computer software company
Large integrated oil and gas company
Mobile phone service operator
R&D-based pharmaceutical manufacturer
Retail grocery company
R&D-based semiconductor manufacturer
Assignment: Using the financial statement data provided in Exhibits 2, 3, and 4, match the companies with their industry. NOTE: #DIV/0! or #Value! indicates that the item was not separately disclosed.
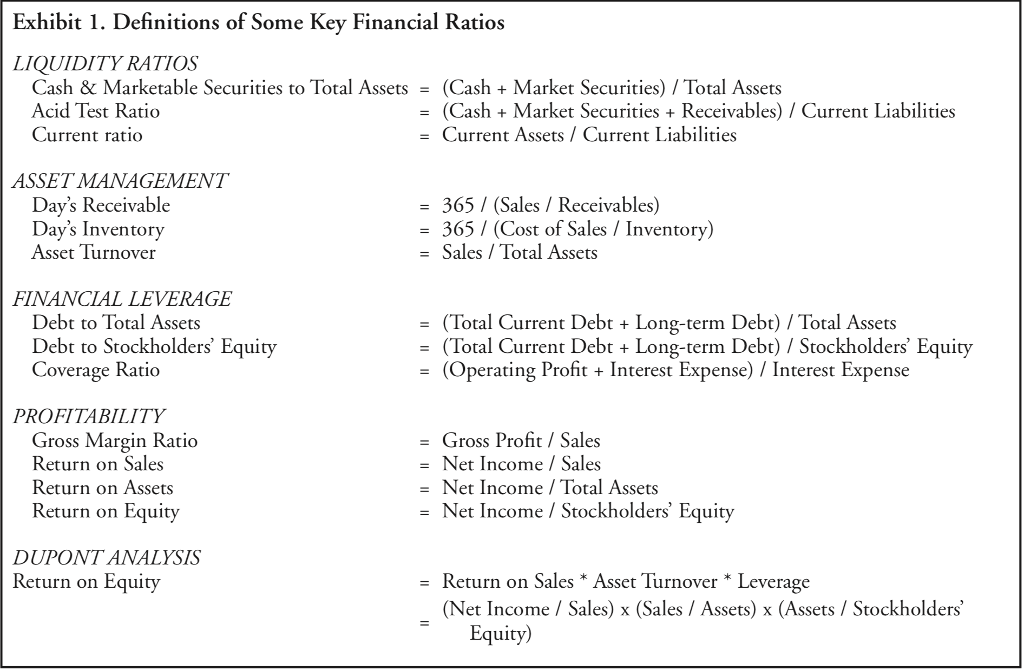
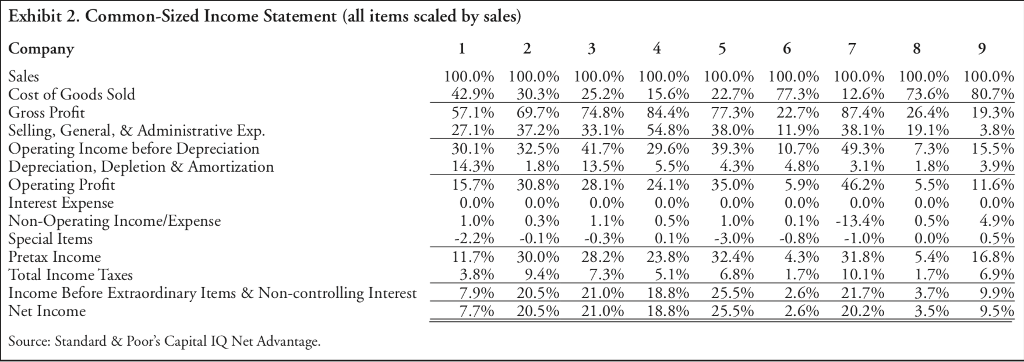
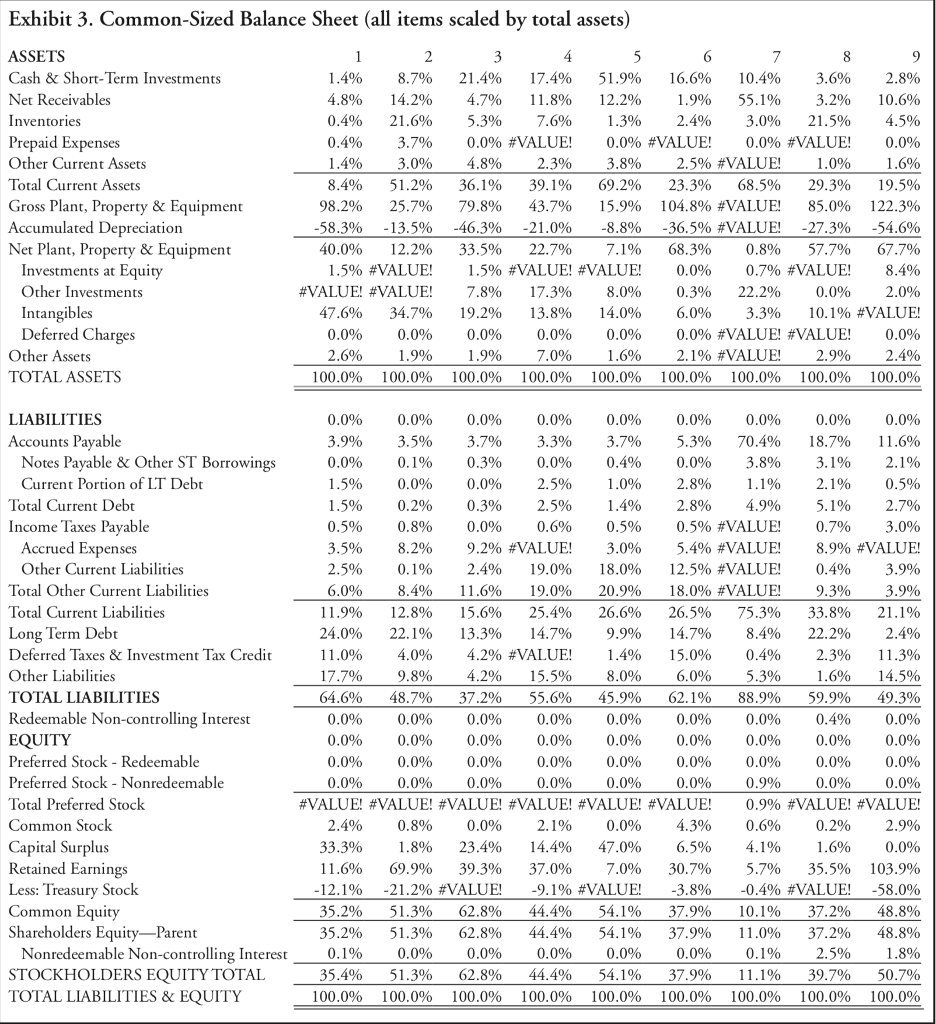
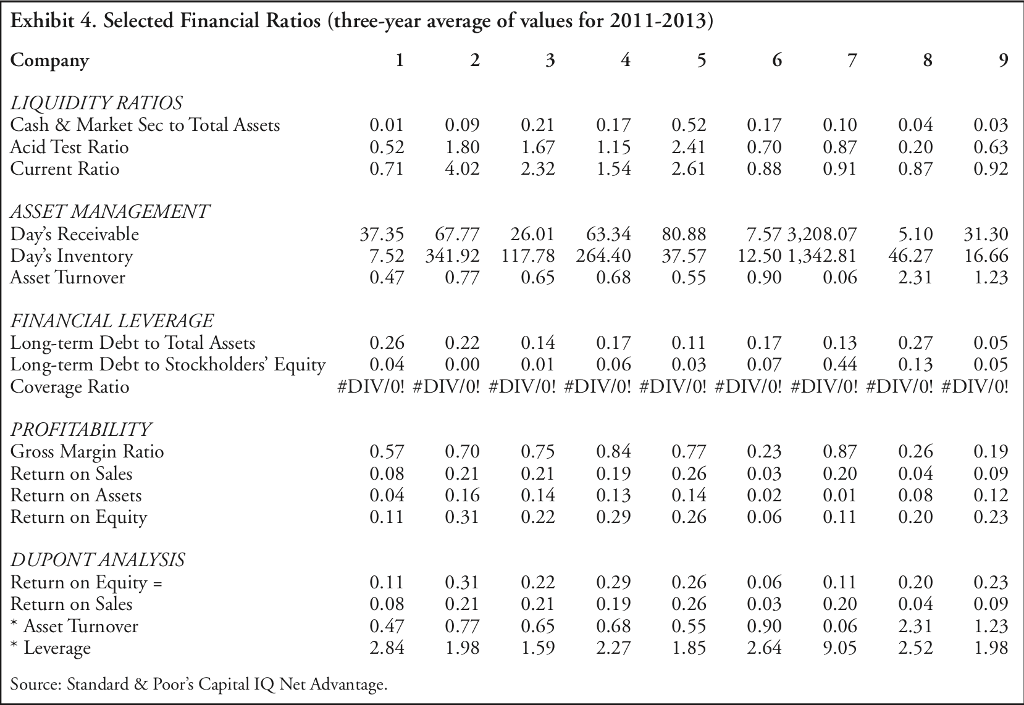
Exhibit 1. Definitions of Some Key Financial Ratios LIQUIDITY RATIOS Market Securities)/Total Assets Cash & Marketable Securities to Total Assets - (Cash Acid Test Ratio Current ratio = (Cash + Market Securities + Receivables) / Current Liabilities = Current Assets / Current Liabilities ASSET MANAGEMENT Day's Receivable = 365 / (Sales / Receivables) Day's Inventory Asset Turnover = 365 / (Cost of Sales / Inventory) = Sales / Total Assets FINANCIAL LEVERAGE Debt to Total Assets Debt to Stockholders' Equity Coverage Ratio (Total Current Debt + Long-term Debt) / Total Assets = (Total Current Debt + Long-term Debt) / Stockholders' Equity = (Operating Profit + Interest Expense) / Interest Expense Ll1 PROFITABILITY Gross Margin Ratio Return on Sales Return on Assets Return on Equity Gross Profit / Sales = Net Income / Sales Net Income / Total Assets Net Income / Stockholders' Equity DUPONT ANALYSIS Return on Equity Return on Sales * Asset Turnover * Leverage (Net Income / Sales) x (Sales / Assets) x (Assets / Stockholders Equity Exhibit 1. Definitions of Some Key Financial Ratios LIQUIDITY RATIOS Market Securities)/Total Assets Cash & Marketable Securities to Total Assets - (Cash Acid Test Ratio Current ratio = (Cash + Market Securities + Receivables) / Current Liabilities = Current Assets / Current Liabilities ASSET MANAGEMENT Day's Receivable = 365 / (Sales / Receivables) Day's Inventory Asset Turnover = 365 / (Cost of Sales / Inventory) = Sales / Total Assets FINANCIAL LEVERAGE Debt to Total Assets Debt to Stockholders' Equity Coverage Ratio (Total Current Debt + Long-term Debt) / Total Assets = (Total Current Debt + Long-term Debt) / Stockholders' Equity = (Operating Profit + Interest Expense) / Interest Expense Ll1 PROFITABILITY Gross Margin Ratio Return on Sales Return on Assets Return on Equity Gross Profit / Sales = Net Income / Sales Net Income / Total Assets Net Income / Stockholders' Equity DUPONT ANALYSIS Return on Equity Return on Sales * Asset Turnover * Leverage (Net Income / Sales) x (Sales / Assets) x (Assets / Stockholders Equity
Step by Step Solution
There are 3 Steps involved in it

Get step-by-step solutions from verified subject matter experts