

Question: I. (Probably you want to do it in excel or your spreadsheet of choice) Consider the following table with the values for two variables at
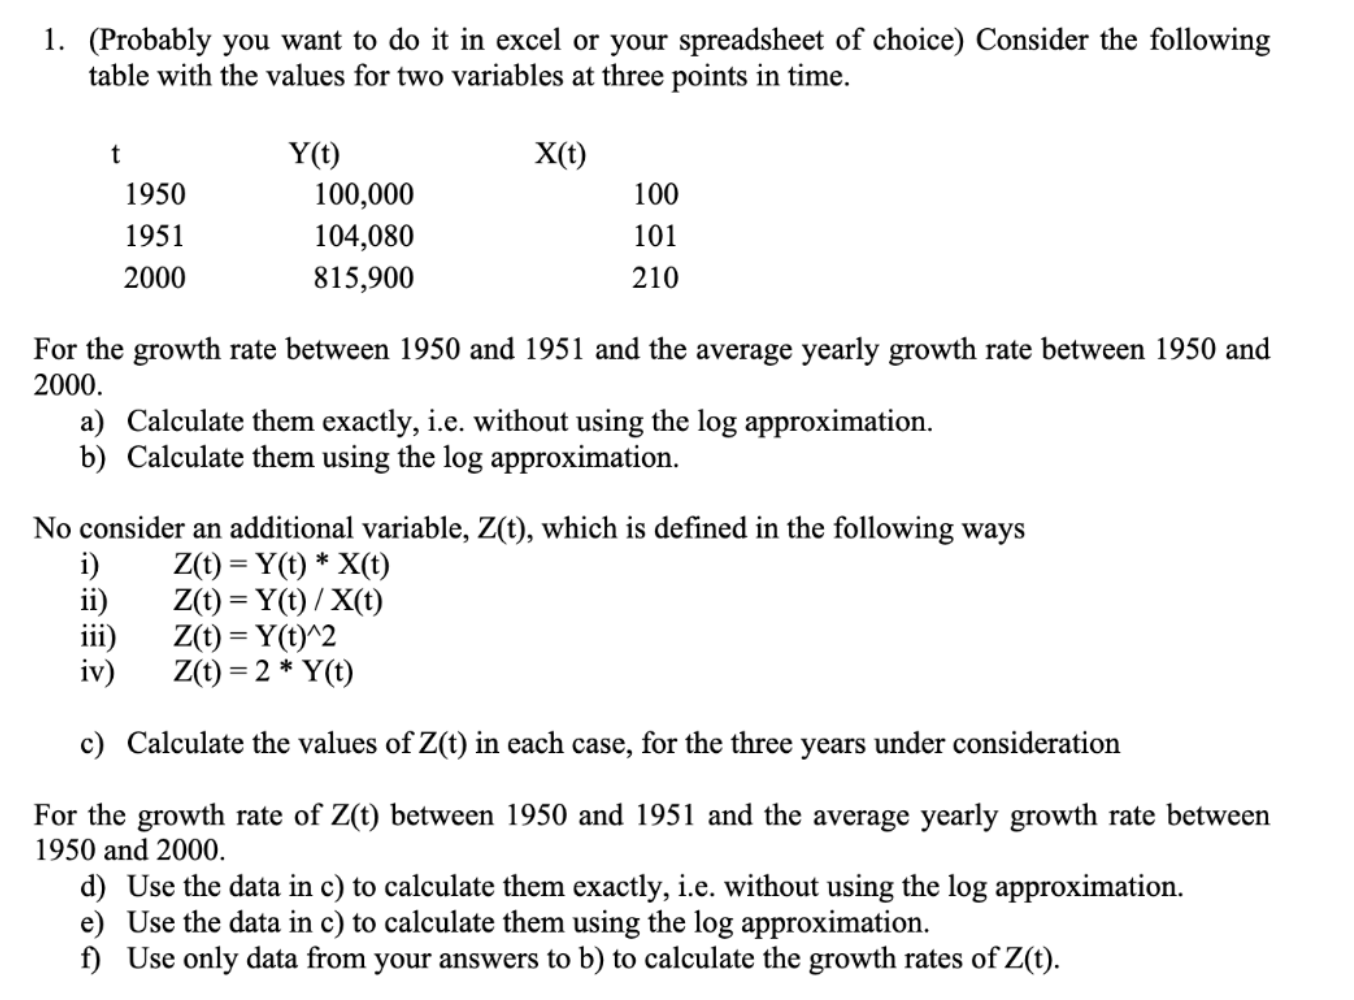

I. (Probably you want to do it in excel or your spreadsheet of choice) Consider the following table with the values for two variables at three points in time. t Y(t) X(t) 1950 100,000 100 1951 104,030 101 2000 815,900 210 For the growth rate between 1950 and 1951 and the average yearly growth rate between 1950 and 2000. a) Calculate them exactly, i.e. without using the log approximation. b) Calculate them using the log approximation. No consider an additional variable, Z(t), which is dened in the following ways i) Z(t) = Y(t) * X(t) ii) Z(t) = Y(t) / X(t) iii) Z(t) = Y(t)"2 iv) Z(t) = 2 * Y(t) c) Calculate the values of Z(t) in each case, for the three years under consideration For the growth rate of Z(t) between 1950 and 1951 and the average yearly growth rate between 1950 and 2000. d) Use the data in c) to calculate them exactly, i.e. without using the log approximation. e) Use the data in c) to calculate them using the log approximation. 1) Use only data from your answers to b) to calculate the growth rates of Z(t)
Step by Step Solution
There are 3 Steps involved in it

Get step-by-step solutions from verified subject matter experts