

Question: I Problem 646 Interpretation of Data Analytics; Data Visualization; Using Tableau Displays (LOBT, 68:: % Review Exhibit 512, which is a Tableau portrayal of the

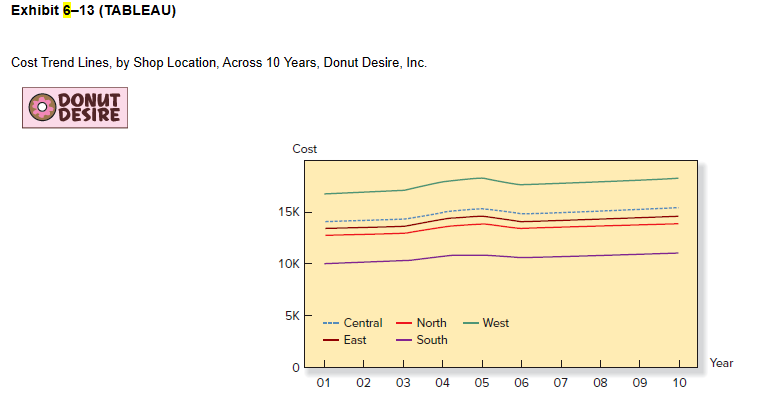

I Problem 646 Interpretation of Data Analytics; Data Visualization; Using Tableau Displays (LOBT, 68:: % Review Exhibit 512, which is a Tableau portrayal of the regression results for Donut Desire's ve donut shop locations, based on the entire 10-year data set (i.e., the past 10 years). In addition, review Exhibit 613. which is a Tableau display of cost trend lines for the ve shop locations across the past 10 years. Required: 1. Explain the differences between these two exhibits in terms of the information presented. What does each exhibit tell a manager about future utility costs in each shop? 2. Use the regression result [in equation form} for each store, which are given in the chapter, to predict utility costs for each of the following two donut shops in a future month with the predicted sales demand levels indicated below: 0 West location, demand of 50,000 units (i.e., dozens of bakery items sold}. 0 South location, demand of 100,000 units (i.e.r dozens of bakery items sold). 3. which shop location has the highest variable cost per unit (i.e., dozen bakery items sold}? Referring to your answer to requirement 2, which shop has the highest predicted utility cost for the future month in question? Explain why that shop has the highest predicted utility cost? 4. Refer to Exhibit 615, which is a Tableau presentation of quarterly activity and utility cost for the ve shop locations. In which month of Year 2 does the Central location appear to exhibit its highest utility cost? Explain why that month exhibits Central shop's highest utility cost of Year 2. Quarterly Activity and Utility Cost, All Five Donut Shops (Stacked Presentation), 10-Year Data Set (Truncated), Donut Desire, Inc. DONUT DESIRE 01 02 03 04 Activity Q1 Q2 Q3 04 Q1 Q2 Q3 04 Q1 Q2 Q3 04 Q1 Q2 100K 50K 0 Cost 6K 4K 2K 0 Central _ East _ North South WestExhibit 6-13 (TABLEAU) Cost Trend Lines, by Shop Location, Across 10 Years, Donut Desire, Inc. DONUT DESIRE Cost 15K 10K 5K --- Central - North - West - East - South Year 01 02 03 04 05 06 07 08 09 10Exhibit 6-12 (TABLEAU) Regression Analysis, by Shop Location, Based on 10-Year Data Set, Donut Desire, Inc. DONUT DESIRE Utility cost 1,800 1,600 100 1,400 O 1,200 1,000 800 0 Activity* 14K 15K 16K 17K 18K 19K 20K 21K 22K 23K 24K 25K Location Central East . North . South West `Activity measured in dozens of bakery items sold; K denotes thousands
Step by Step Solution
There are 3 Steps involved in it

Get step-by-step solutions from verified subject matter experts