

Question: I really need help :( 2. Scatter plots and calculating correlation Suppose you are given the following five pairs of scores: X Y 3 1
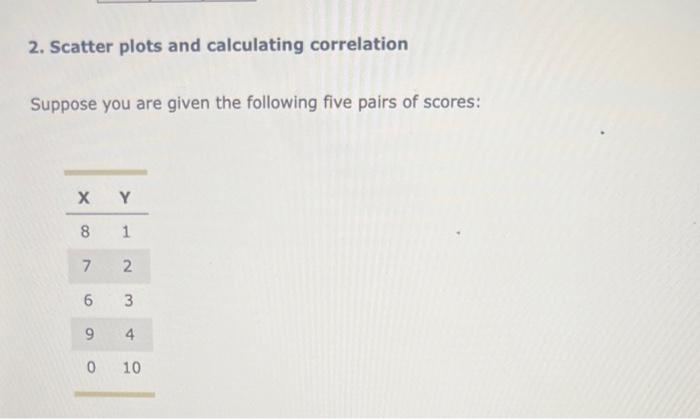
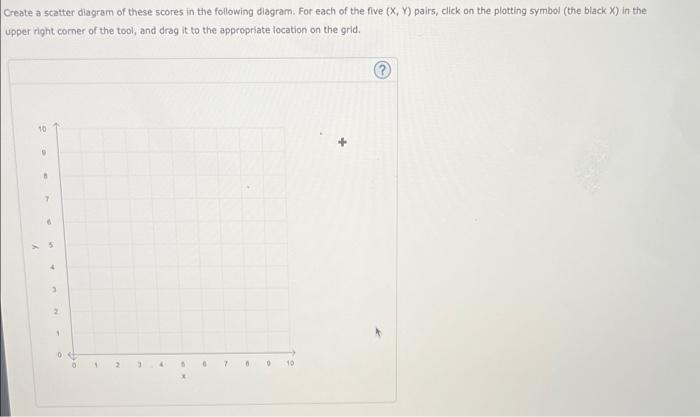
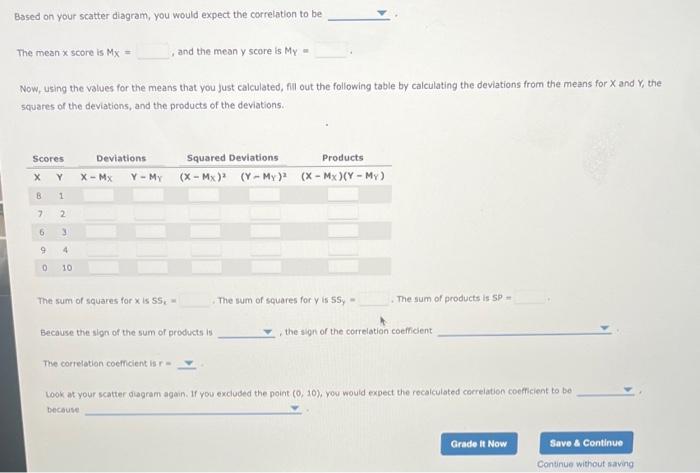
2. Scatter plots and calculating correlation Suppose you are given the following five pairs of scores: X Y 3 1 7 2 6 LO 3 9 9 4 0 10 Create a scatter diagram of these scores in the following diagram. For each of the five (x, ) pairs, click on the plotting symbol (the black X) in the upper right corner of the tool, and drag it to the appropriate location on the grid. 10 . 7 5 3 2 1 0 2 7 0 10 Based on your scatter diagram, you would expect the correlation to be The mean x score is Mx and the mean y score is My - Now, using the values for the means that you just calculated, fill out the following table by calculating the deviations from the means for X and Y the squares of the deviations, and the products of the deviations Products Scores X Y Deviations X-MX Y-MY Squared Deviations (x - Mx) (Y-My (x - Mx )(Y-MY) 1 7 2 6 3 9 4 0 10 The sum of squares for xis SSE The sum of squares for yis 55 The sum of products is SP Because the sign of the sum of products.lu the son of the correlation coefficient The correlation coeficient is Look at your scatter diagram again. If you excluded the point(0, 10), you would expect the recalculated correlation coefficient to be because Grade It Now Save & Continue Continue without saving
Step by Step Solution
There are 3 Steps involved in it

Get step-by-step solutions from verified subject matter experts