

Question: I really need help with the graph. please lable everything. will give thumbs up 5E 120 pts Suppose that the relationship between the number of
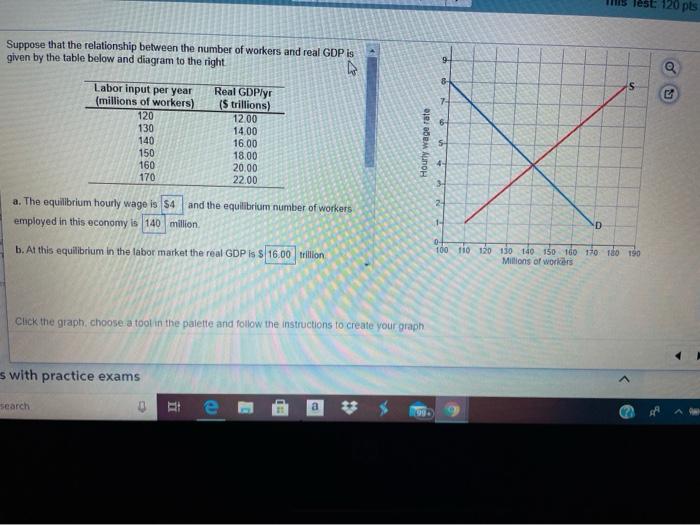
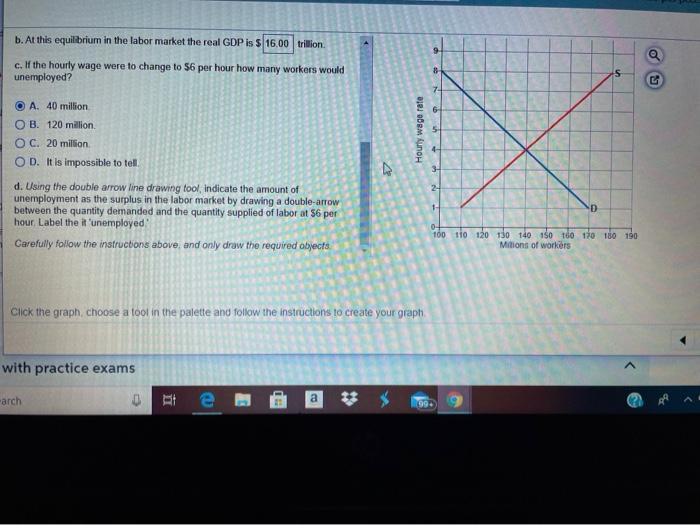
5E 120 pts Suppose that the relationship between the number of workers and real GDP is given by the table below and diagram to the right S Labor input per year (millions of workers) 120 130 140 150 160 170 Real GDPyr ($ trillions) 12.00 14.00 16.00 18.00 20.00 22.00 Hourly wage rate 2- a. The equilibrium hourly wage is $4 and the equilibrium number of workers employed in this economy is 140 million 14 D b. At this equilibrium in the labor market the real GDP is S 16.00 trillion 0- 100 110 120 130 140 150 160 170 do 190 Millions of workers Click the graph. choose a tool in the palette and follow the instructions to create your graph s with practice exams search DE e a b. At this equilibrium in the labor market the real GDP is $ 16.00 trillion. c. If the hourly wage were to change to $6 per hour how many workers would unemployed? 8 A. 40 million Hourly wage rate 3 OB. 120 million O C. 20 million OD. It is impossible to tell d. Using the double arrow line drawing tool, indicate the amount of unemployment as the surplus in the labor market by drawing a double-arrow between the quantity demanded and the quantity supplied of labor at S6 per hour Label the it'unemployed Carefully follow the instructions above and only draw the required objects 2- + 0-4 100 110 120 130 140 80 Toto 180 180 Milions of workers Click the graph choose a tool in the palette and follow the instructions to create your graph with practice exams arch e E a * 99
Step by Step Solution
There are 3 Steps involved in it

Get step-by-step solutions from verified subject matter experts