

Question: I really need help with the summary . Please . The sale price data for an apartment unit complex consisting of two adjacent and connecting
I really need help with the summary . Please .
The sale price data for an apartment unit complex consisting of two adjacent and connecting eight-floor buildings are given in the excel file named Project data. The complex contains two hundred units, each unit approximately five hundred square feet (note that some units may have been resold and hence number of data points may be more than 200). The locations of the units relative to the sea, the swimming pool, the parking lot, etc. are shown in the figure below.
Building Beta
Building Alpha
Sea
There are several features of the complex that you should note:
- The units facing north, called beach view, face the beach and ocean. In addition, units in building Alpha have a good view of the swimming pool. Units facing south called sand-view, face the parking lot and an area of land that eventually borders a bay.
- The only elevator in the complex is located at the west end of building Alpha, as are the office and game room. People living in the higher floor units in building Beta would likely use the elevator and move through the passages to their units. Thus, the units on the higher floors and farther from the elevator would be less convenient; they would require considerably more effort in moving baggage, shopping goods, etc., and they would also be further away from the game room and the office. But these units carry a small benefit: there would not be much traffic through the passages in the area and hence can give some privacy.
- Lower-floor, beachside units are probably best suited for people who are active. They are within easy reach of the beach, the swimming pool, the game room and they are close to the parking lot as well.
- From the layout of the apartment complex, you can also see that some of the units in the center of the complex have part of their view blocked because of building Beta.
- The apartment complex was completed at the time of the 2007 recession; So, there were not many ready buyers and the maker was forced to sell the complex at an auction, 9 months after opening. This is in contrast to how real estate general works, which are usually seller and broker specified. Whereas in this case the prices are completely buyer-specified and hence customer-oriented.
- Some of the units in the complex were furnished (had furniture) by the maker and some were not.
Given the information above, the current owner of the apartment complex is unsure of how the floor level of the unit (floor numbers), proximity to the elevator, advantage of a beach view, etc. affect the prices of the units sold at auction. Your task is to investigate these relationships using the given data.
- Sale price. Measured in thousands of dollars.
- Floor level. The floor location of the unit; the levels range from one to eight.
- Distance (Elevator proximity). This is simply the number of apartment units from the elevator. Two more points were added to the apartments in building Beta to account for the walking distance in the connecting area between the two buildings. Thus, the distance of unit 107 from the elevator would be Four, and the distance between unit 115 and the elevator would be ten. The distance is also given on the figure.
- View of the beach. This simply marks whether it is possible to see the beach view or not and specified with a dummy variable, 1 if the unit has a beach view and 0 otherwise.
- End variable. This variable to denote the units present in the center of the complex is also specified with a dummy variable, 1 for units whose view of the sea is partially blocked and 0 otherwise.
- Furniture. 1 means the unit has some furniture and 0 if otherwise.
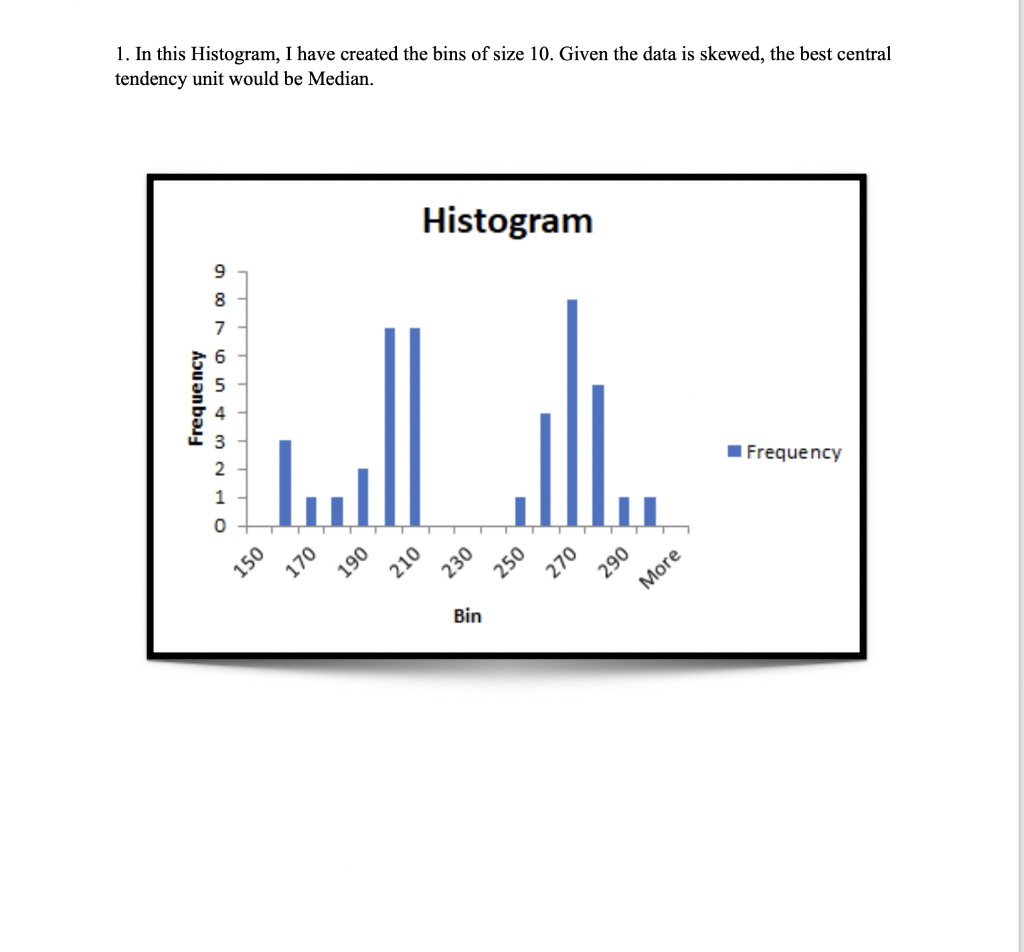
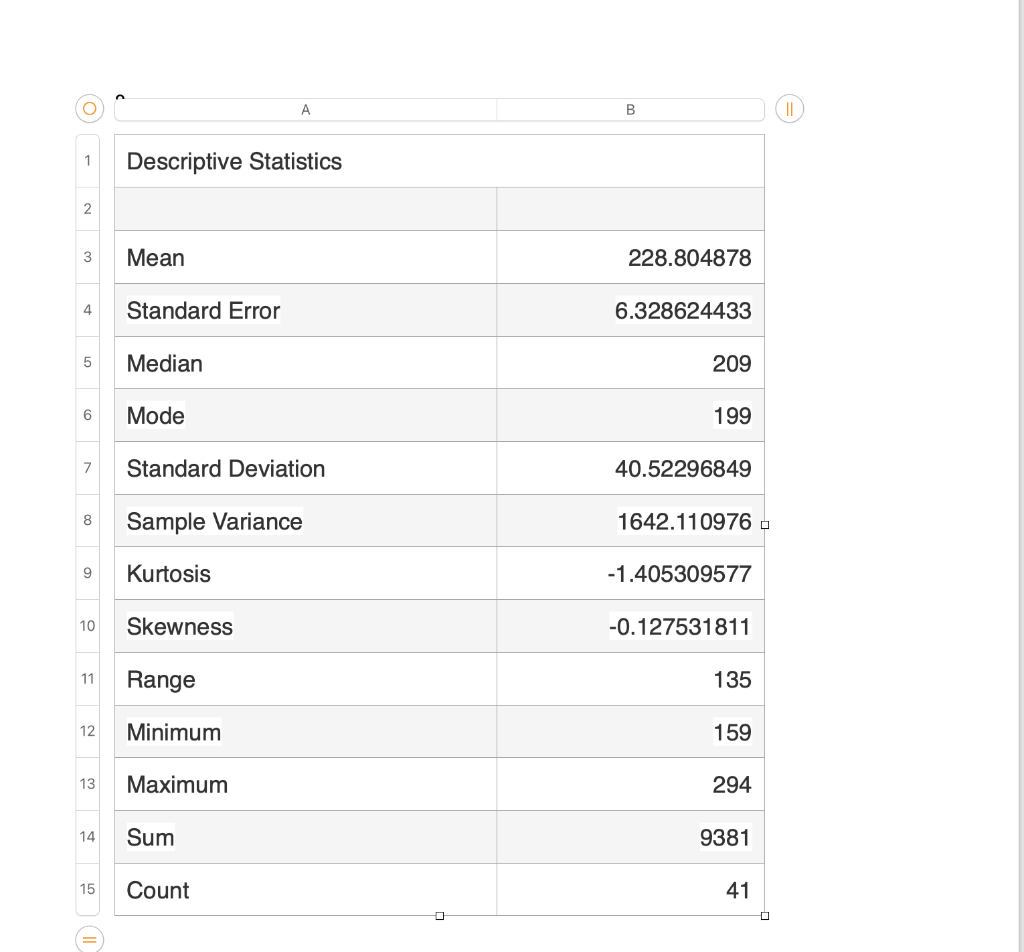
- Analyze the sale price data using descriptive statistics, frequency distribution, and other tools (no need to compare sale price based on other variables which you will be doing in question 2. In this question look only at sale price). Use charts and figures to present and aid your analysis. Which measure of central tendency would you use? (1-2 paragraphs)
- Analyze what factors influence the sale price. Use any of the methods (including figures and tables) discussed in the course to answer this question. (Do not use regression which is specifically asked in question 3. Hint: Use Pivot tables to slice and dice based on multiple factors, create bar charts based on different factors, etc. Summarize your observations.). (1-2 paragraphs)
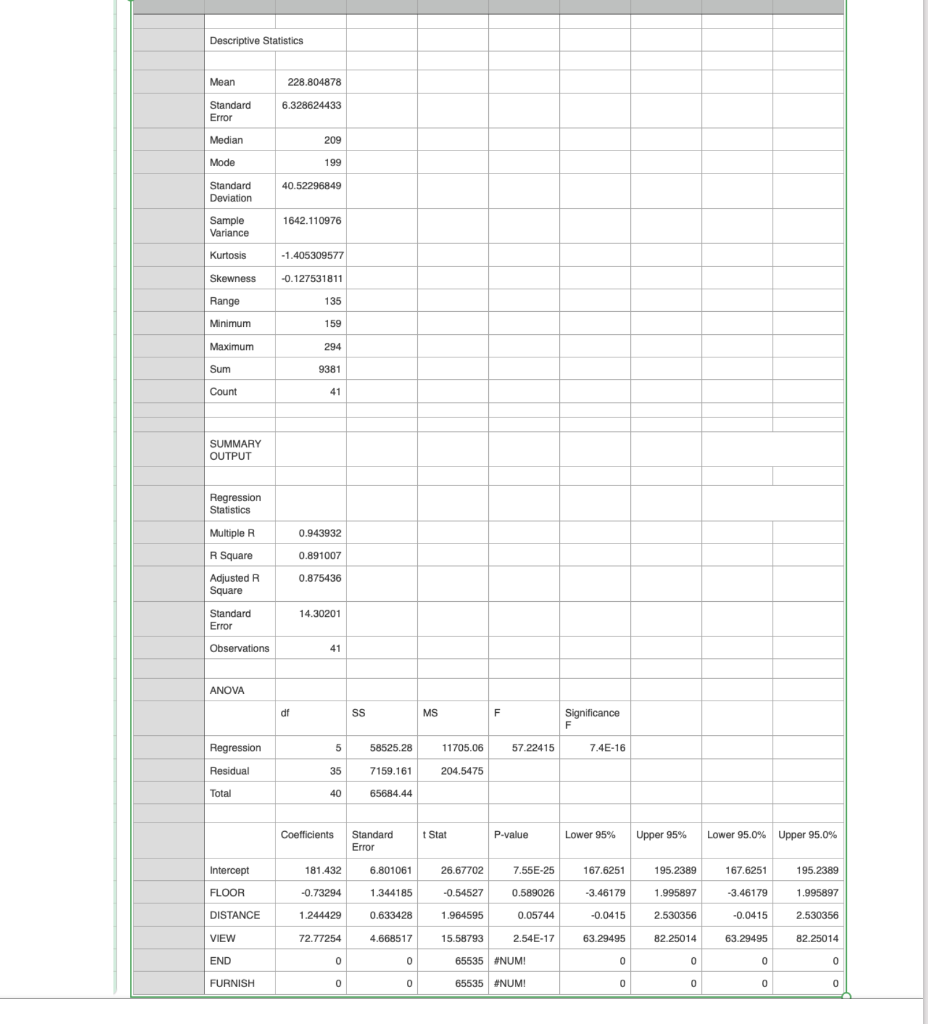
- Build a (multi variable) regression model that predicts the sale price of an apartment unit. Present the regression output in your report.
- Prepare a professional summary report (2-3 paragraphs) that presents the results of your regression analysis. Be sure to interpret some of the coefficients. What are some conclusions and implications for an interested buyer? (Present details regarding what the regression output means at a managerial level
- Prepare a technical summary of your regression analysis (2-3 paragraphs), including any limitations in your analysis. Technical summary should include details regarding p-value, R-square and other technical aspects of a regression.
1,2,3 ,4,5
Step by Step Solution
There are 3 Steps involved in it

Get step-by-step solutions from verified subject matter experts