

Question: I require help with this problem, how would I solve this ? A random sample of MI =16 communities in western Kansas gave the following
I require help with this problem, how would I solve this ?
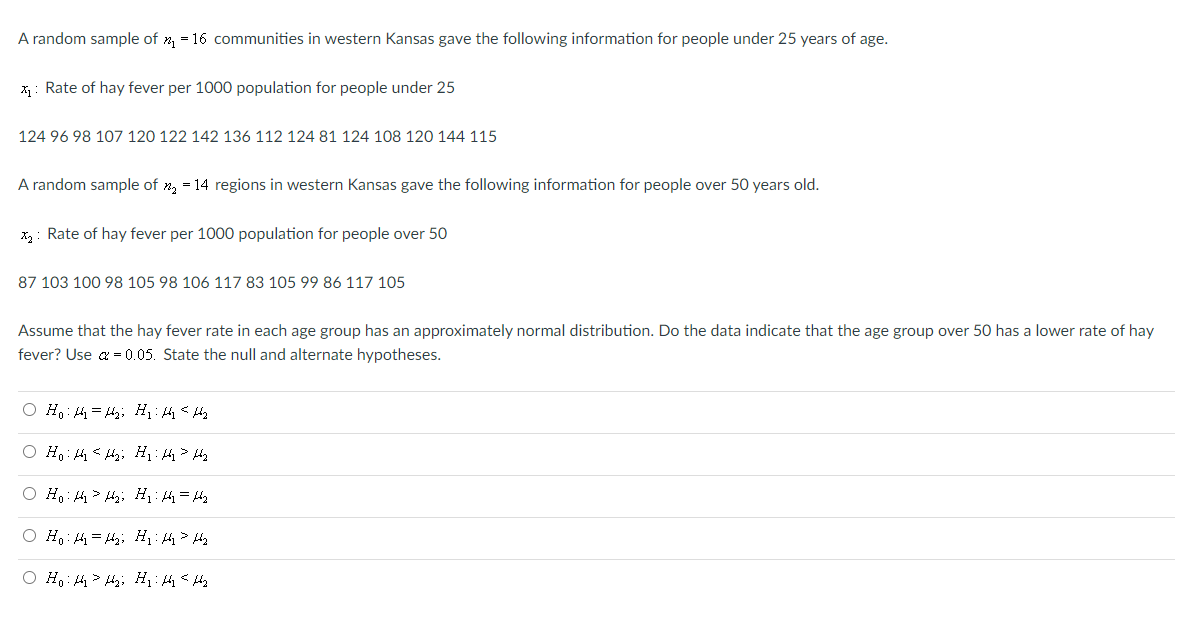
A random sample of MI =16 communities in western Kansas gave the following information for people under 25 years of age. x1 : Rate of hay fever per 1000 population for people under 25 124 96 5'8 10? 120 122 142 136 112 124 81 124 105 120 144 115 A random sample of 212 = 14 regions in western Kansas gave the following information for people over 50 years old. 2rg : Rate of hay fever per 1000 population for people over 50 B7 103 100 9B 105 93 106 117 83 105 99 86 11? 105 Assume that the hay fever rate in each age group has an approximately normal distribution. Do the data indicate that the age group over 50 has a lower rate of hay fever? Use a: = 0.05. State the null and alternate hypotheses. 0 Ho #1:#2;H13#1#2 0 Ho #1>#2;H13#1=#2 0 Ho #1=#2;H1'#1>2 0 Ha #1>#2: H1'#1(#2
Step by Step Solution
There are 3 Steps involved in it

Get step-by-step solutions from verified subject matter experts