

Question: I require the solutions for question 2 and 3, questions are below.. Q. 2: (4) 100 randomly selected light bulbs were tested to determine their
I require the solutions for question 2 and 3, questions are below..
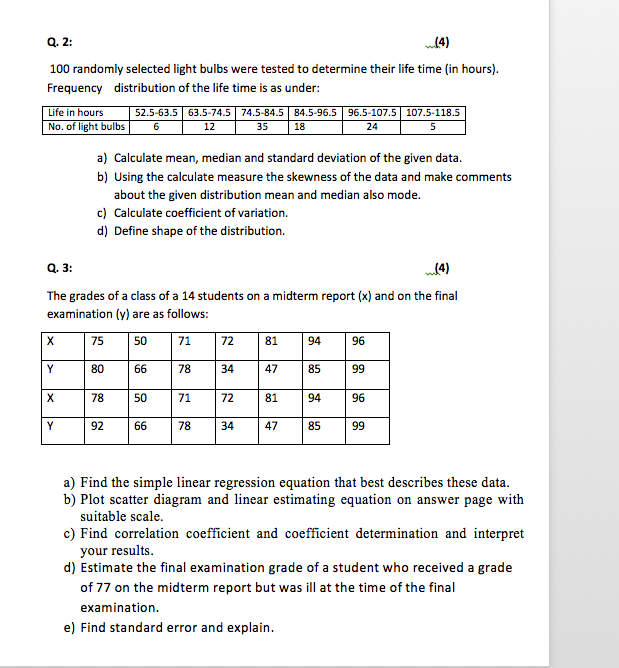
Q. 2: (4) 100 randomly selected light bulbs were tested to determine their life time (in hours). Frequency distribution of the life time is as under: Life in hours 52.5-63.5 63.5-74.5 74.5-84.5 84.5-96.5 96.5-107.5 107.5-118.5 No. of light bulbs 6 12 35 18 24 5 a) Calculate mean, median and standard deviation of the given data. b) Using the calculate measure the skewness of the data and make comments about the given distribution mean and median also mode. c) Calculate coefficient of variation. d) Define shape of the distribution. Q. 3: (4) The grades of a class of a 14 students on a midterm report (x) and on the final examination (y) are as follows: X 75 50 71 72 81 94 96 Y 80 66 78 34 47 85 99 X 78 50 71 72 81 94 96 92 66 78 34 47 85 99 a) Find the simple linear regression equation that best describes these data. b) Plot scatter diagram and linear estimating equation on answer page with suitable scale. c) Find correlation coefficient and coefficient determination and interpret your results. d) Estimate the final examination grade of a student who received a grade of 77 on the midterm report but was ill at the time of the final examination. e) Find standard error and explain
Step by Step Solution
There are 3 Steps involved in it

Get step-by-step solutions from verified subject matter experts