

Question: I sent the first question for information. The second question is what I need. techniques on a historical data that they have in terms of
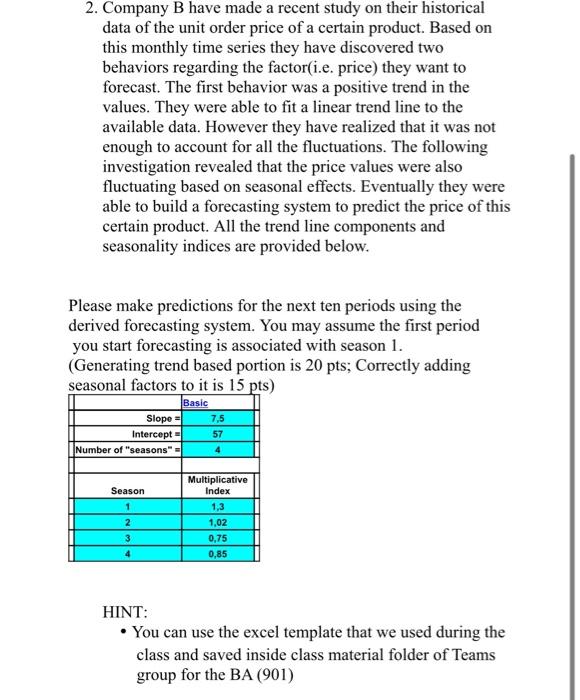
I sent the first question for information. The second question is what I need. 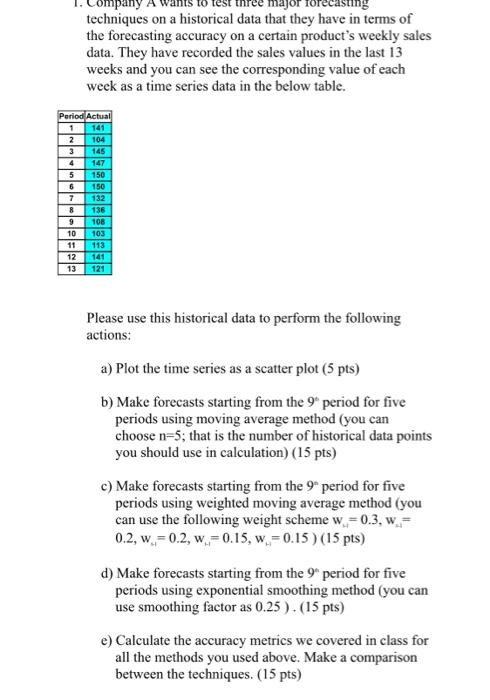
Step by Step Solution
There are 3 Steps involved in it
1 Expert Approved Answer
Step: 1 Unlock

Question Has Been Solved by an Expert!
Get step-by-step solutions from verified subject matter experts
Step: 2 Unlock
Step: 3 Unlock