

Question: I sent third this question but these incomplete. Please solve and send me full tables. Consider the venturi meter-experiment video at I, where the measurements
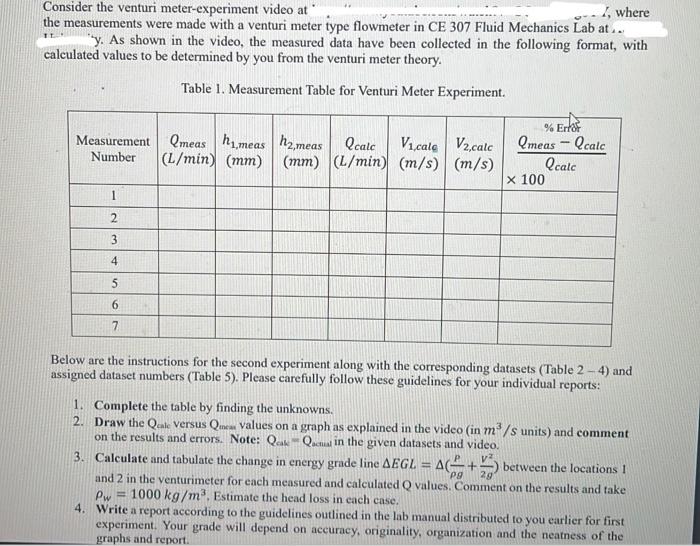
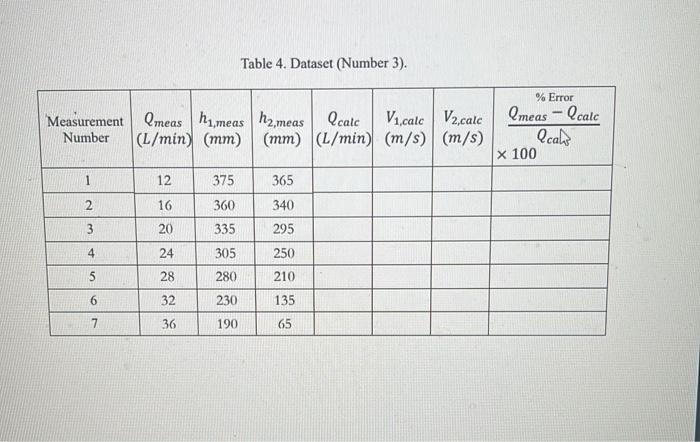
Consider the venturi meter-experiment video at I, where the measurements were made with a venturi meter type flowmeter in CE 307 Fluid Mechanics Lab at.. y. As shown in the video, the measured data have been collected in the following format, with calculated values to be determined by you from the venturi meter theory. Table 1. Measurement Table for Venturi Meter Experiment. Below are the instructions for the second experiment along with the corresponding datasets (Table 2 - 4) and assigned dataset numbers (Table 5). Please carefully follow these guidelines for your individual reports: 1. Complete the table by finding the unknowns. 2. Draw the Qabe versus Qnem values on a graph as explained in the video (in m3/s units) and comment on the results and errors. Note: Qakt=Qactial in the given datasets and video. 3. Calculate and tabulate the change in energy grade line EGL=(gP+2gV2) between the locations 1 and 2 in the venturimeter for each measured and calculated Q values. Comment on the results and take w=1000kg/m3. Estimate the head loss in each case. 4. Write a report according to the guidelines outlined in the lab manual distributed to you earlier for first experiment. Your grade will depend on aceuracy, originality, organization and the neatness of the graphs and report. Table 4. Dataset (Number 3)
Step by Step Solution
There are 3 Steps involved in it

Get step-by-step solutions from verified subject matter experts