

Question: i solved the graph...is it right? In the diagram below, draw the price effect and the quantity effect for a price change from $60 to
i solved the graph...is it right?
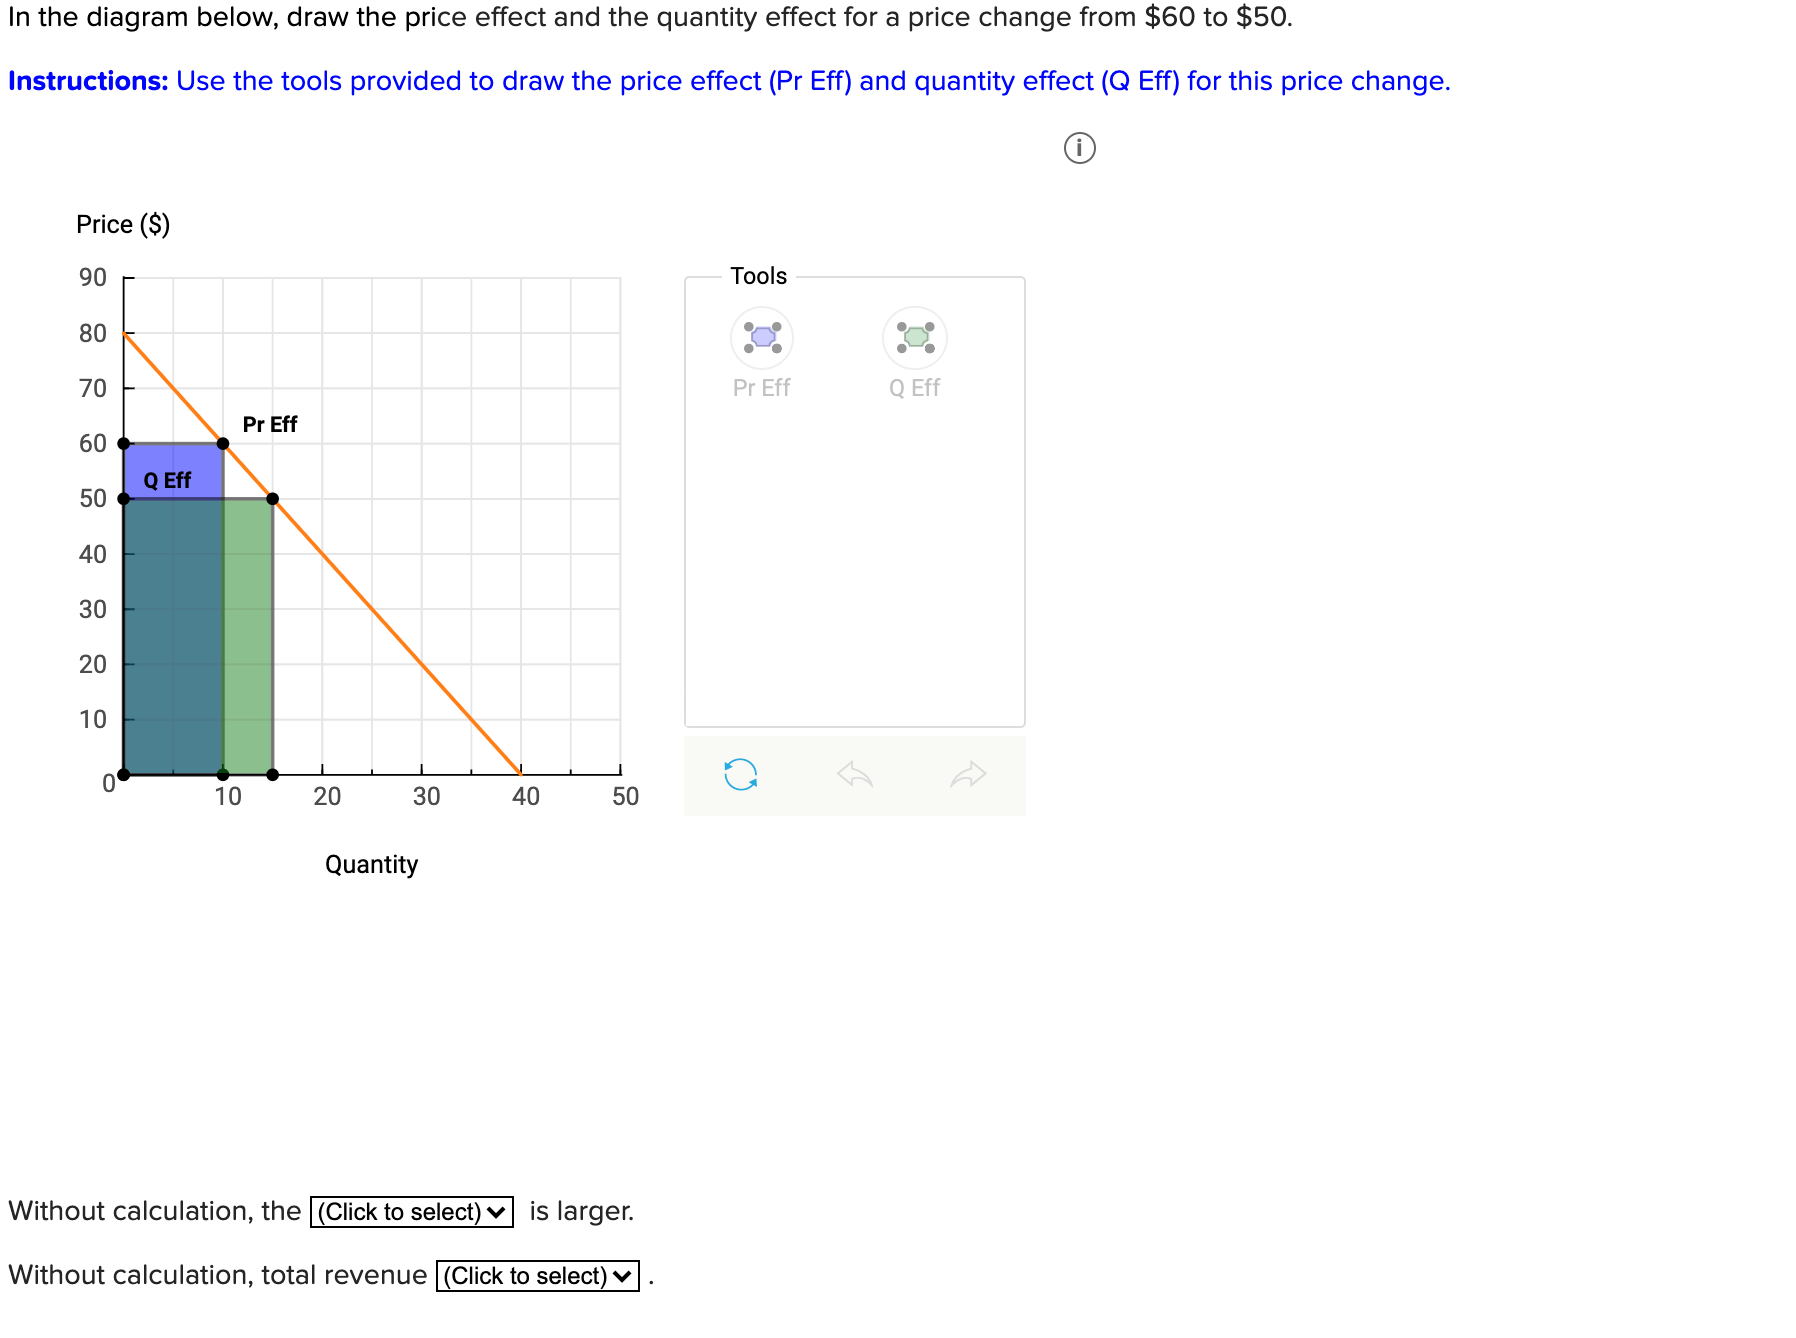
In the diagram below, draw the price effect and the quantity effect for a price change from $60 to $50. Instructions: Use the tools provided to draw the price effect (Pr Eff) and quantity effect (Q Eff) for this price change. Price ($) 90 Tools 80 70 Pr Eff Q Eff 60 Pr Eff 50 Q Eff 40 30 20 10 10 20 30 40 50 Quantity Without calculation, the (Click to select) v | is larger. Without calculation, total revenue (Click to select) v
Step by Step Solution
There are 3 Steps involved in it
1 Expert Approved Answer
Step: 1 Unlock

Question Has Been Solved by an Expert!
Get step-by-step solutions from verified subject matter experts
Step: 2 Unlock
Step: 3 Unlock