

Question: i started it but cant do the summary sheets i a Perform a Forecast for February 1, 2005 using the 6 methods discussed in class:
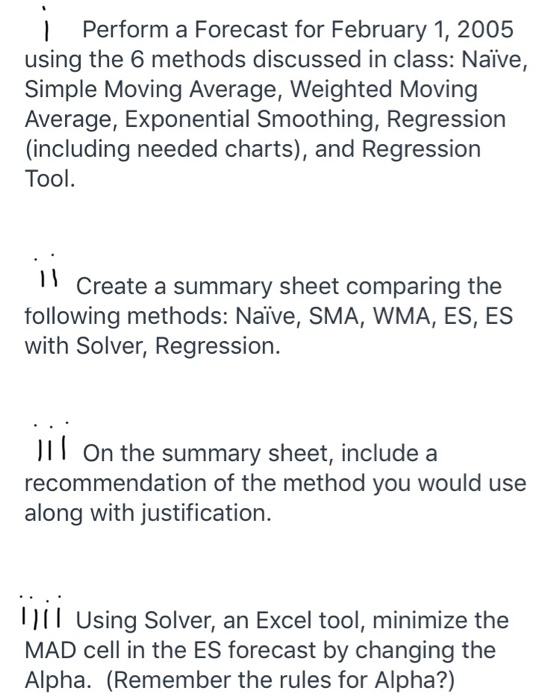
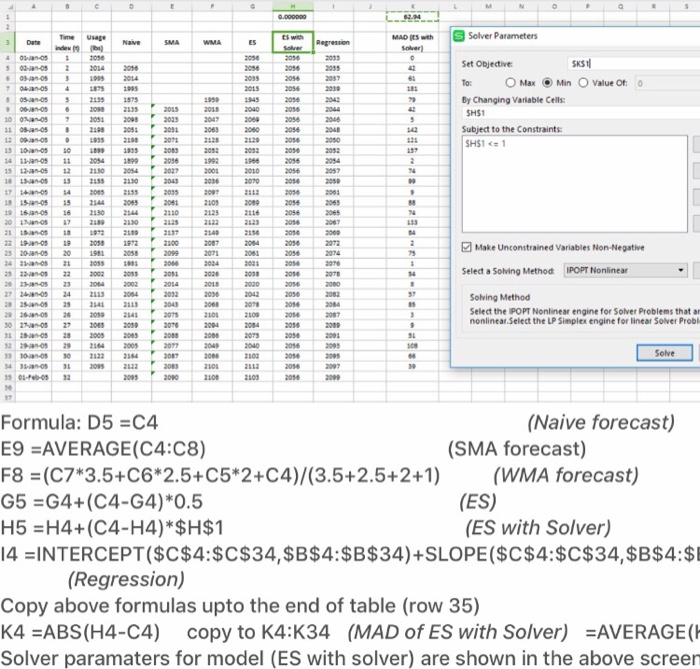
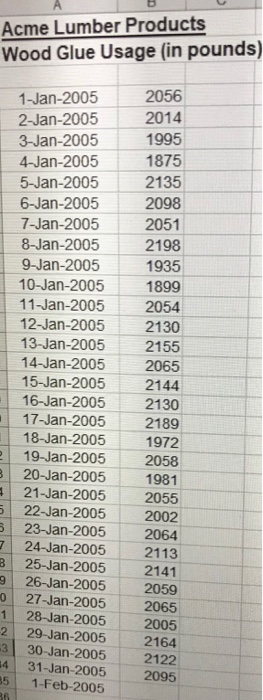
i a Perform a Forecast for February 1, 2005 using the 6 methods discussed in class: Nave, Simple Moving Average, Weighted Moving Average, Exponential Smoothing, Regression (including needed charts), and Regression Tool. ii Create a summary sheet comparing the following methods: Nave, SMA, WMA, ES, ES with Solver, Regression. Jil on the summary sheet, include a recommendation of the method you would use along with justification. nii Using Solver, an Excel tool, minimize the MAD cell in the ES forecast by changing the Alpha. (Remember the rules for Alpha?) c . 0.000000 21 2 Usage 3 Naive SMA WMA ES Time des ! Regression MADS with Solver O 2056 2039 3 4 To: 2056 2014 2005 1875 2135 209 2051 2100 2016 2014 2005 1575 2135 2008 2051 5 . 7 2035 2015 119 2040 2060 2060 1999 2018 2007 2063 Solver Parameters Set Objective SKS 11 Max Min Value Ot: 0 By Changing Variable Cells: SH$ Subject to the Constraints: SHS11 2050 2056 2056 2056 2056 2050 2056 2056 2056 2056 2056 2056 2014 181 79 42 5 142 2037 2030 2042 2044 2006 2048 2010 2053 2014 ONOS nos 5 05 Janos anos 05-05 9 NOS 10 ONS 11 anos 12 00 13 LOS 14 11os 15 12 anos 30 ISO 17 18 nos 19 15 anos 20 Anos 21 OS 22 - 25 2005 24 25 2015 2023 2031 2013 2009 2096 2027 3043 2052 2032 CESO 2054 2999 1999 2014 21:30 2002 2 11 12 21.30 2001 2030 2010 2070 2010 14 15 16 2056 83 2130 2100 2001 2110 2125 2144 21.10 2100 1972 18 14 2067 2000 2072 2014 2156 2064 2001 2050 1981 2015 21 1 2015 2002 2109 2129 2122 2140 2089 2071 2004 2020 2018 2030 2060 2001 2004 2010 2040 2010 2030 2020 2014 2100 2099 2006 2051 2014 2032 2045 2095 2070 25 NOS 27 28 28 SOS . 22 23 24 25 26 27 20 29 2016 2016 2016 2056 2016 2016 2056 2050 2056 2014 2054 2050 2050 2016 2141 Make Unconstrained variables Non-Negative Select a Solving Method IPOPT Nonlinear Solving Method Select the POPT Nonlinear engine for Solver problems that ar nonlinear Select the LP Simplex engine for linear Solver Probl 2070 2080 2082 2014 2007 2000 2001 2009 2005 35 1 3050 2005 2010 2078 2100 2004 2079 2040 2300 30 INN 31 203 SI 108 2077 2007 30 2564 Solve 33 00 14 15 01-10-05 209 2014 10 2000 2100 2103 2056 2000 Formula: D5 =C4 (Naive forecast) E9 =AVERAGE(C4:08) (SMA forecast) F8 = (C7*3.5+C6*2.5+C5*2+C4)/(3.5+2.5+2+1) (WMA forecast) G5 =G4+(C4-G4)*0.5 (ES) H5 =H4+(C4-H4)*$H$1 (ES with Solver) 14 =INTERCEPT($C$4:$C$34,$B$4:$B$34)+SLOPE($C$4:$C$34,$B$4:$ (Regression) Copy above formulas upto the end of table (row 35) K4 =ABS(H4-C4) copy to K4:K34 (MAD of ES with Solver) =AVERAGE( Solver paramaters for model (ES with solver) are shown in the above screen A 3 e a H ! 0.000000 6211 2 Urage Naive Date US WIN SMA Selver Parameters WMA ES Time hdex ! Regression MADS wth Sohver 0 - 3 # 1995 1895 2056 2014 1995 2056 2056 2035 2015 1145 2040 2050 2060 2030 2056 2056 2056 3056 2050 2056 2056 2939 2995 2937 2930 2042 2344 2345 2345 6 18 29 27 5 6 7 3 Set objective SKS 11 To: Max Min Value 01: O By Changing Variable Cells: SHS1 Subject to the Constraints: SHSI
Step by Step Solution
There are 3 Steps involved in it

Get step-by-step solutions from verified subject matter experts