

Question: I stuck in the Spatial Clustering Python. This is the question: Political blogs dataset We will study a political blog dataset first compiled for the
I stuck in the Spatial Clustering Python.
This is the question:
Political blogs dataset
We will study a political blog dataset first compiled for the paper Lada A. Adamic and Natalie Glance, "The political blogosphere and the 2004 US Election", in Proceedings of the WWW-2005 Workshop on the Weblogging Ecosystem (2005). It is assumed that blog-site with the same political orientation are more likely to link to each other, thus, forming a "community" or "cluster" in a graph. In this question, we will see whether or not this hypothesis is likely to be true based on the data.
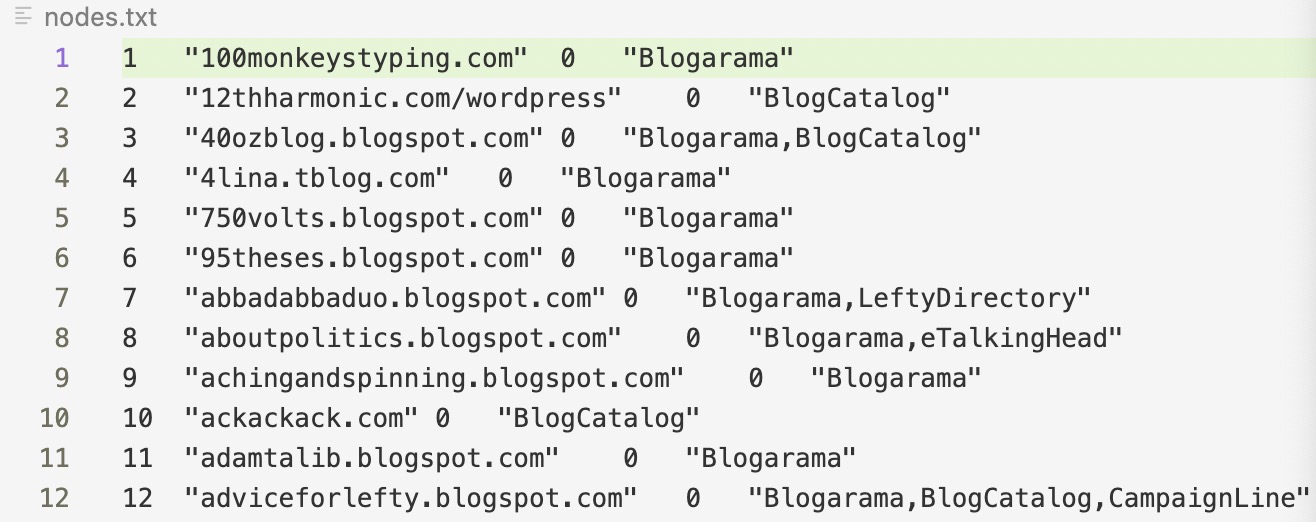
1. The dataset nodes.txt contains a graph with n = 1490 vertices ("nodes") corresponding to political blogs.
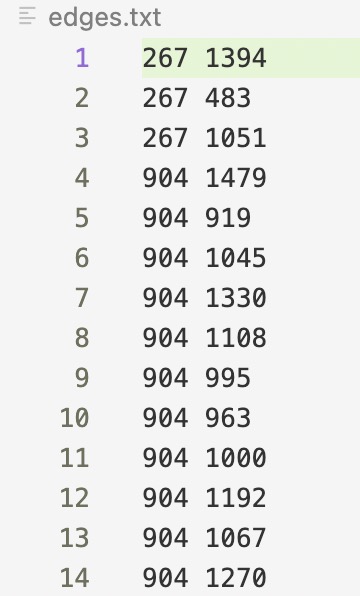
2. The dataset edges.txt contains edges between the vertices. You may remove isolated nodes (nodes that are not connected to any other nodes) in the pre-processing.
We will treat the network as an undirected graph; thus, when constructing the adjacency matrix, make it symmetrical by, e.g., set the entry in the adjacency matrix to be one whether there is an edge between the two nodes (in either direction).
In addition, each vertex has a 0-1 label (in the 3rd column of the data file) corresponding to the true political orientation of that blog. We will consider this as the true label and check whether spectral clustering will cluster nodes with the same political orientation as possible.
These are two questions:
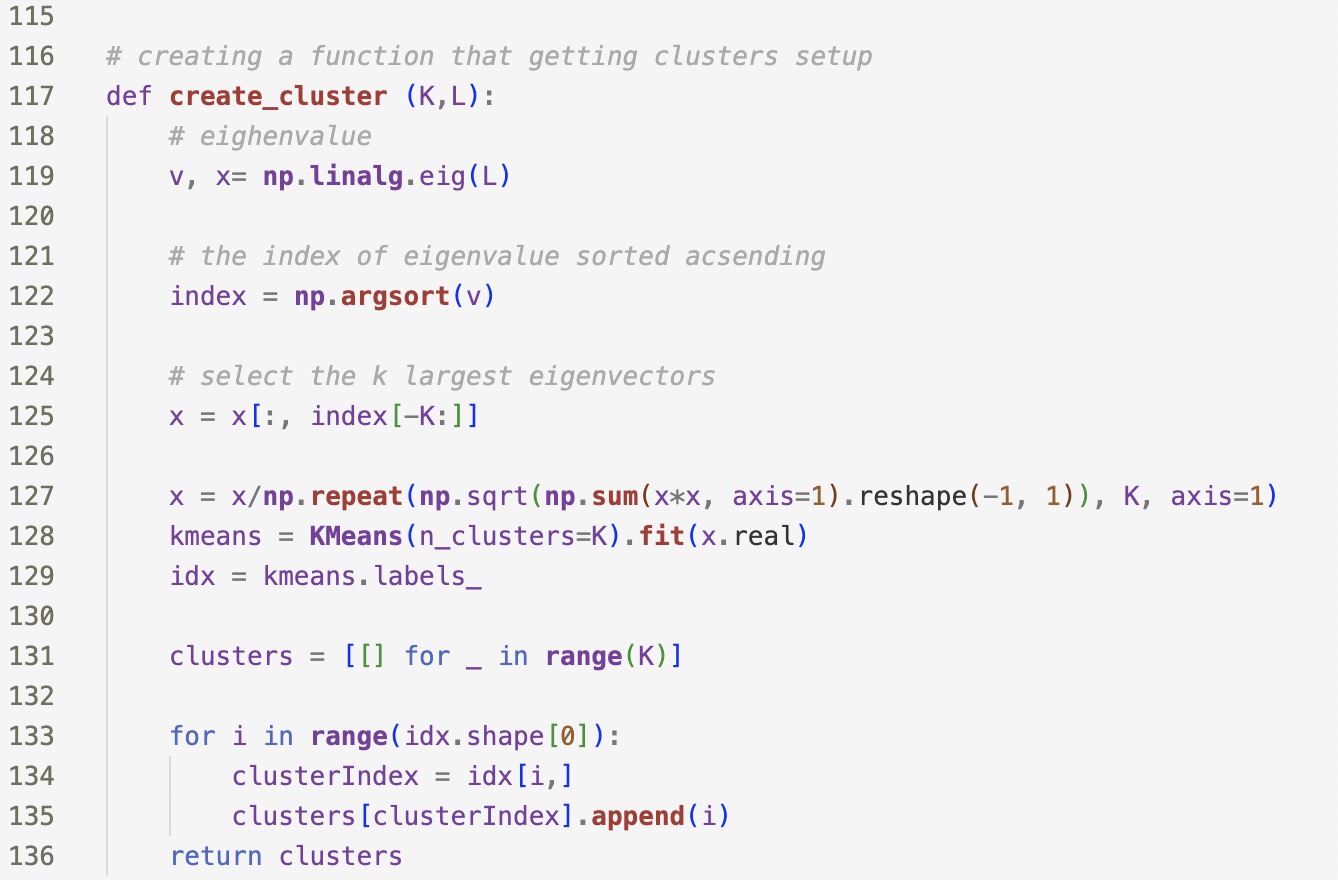
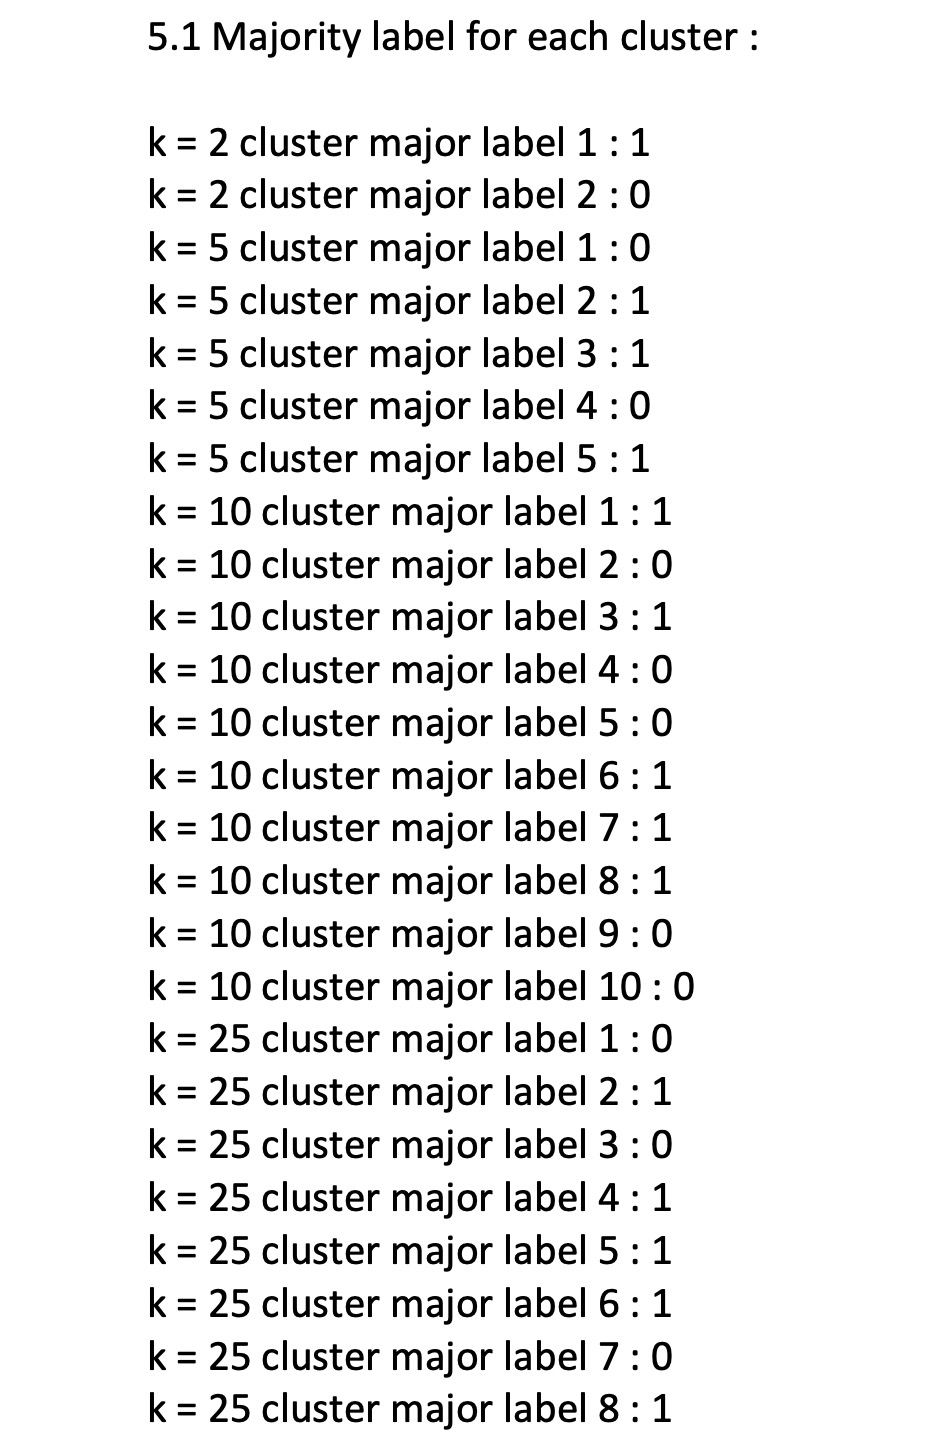
1. Use spectral clustering to find the k = 2, 5, 10, 25 clusters in the network of political blogs (each node is a blog, and their edges are defined in the file edges.txt). Find majority labels in each cluster for different k values, respectively. For example, if there are k = 2 clusters, and their labels are {0, 1, 1, 1} and {0, 0, 1} then the majority label for the first cluster is 1 and for the second cluster is 0. It is required you implement the algorithms yourself rather than calling from a package.
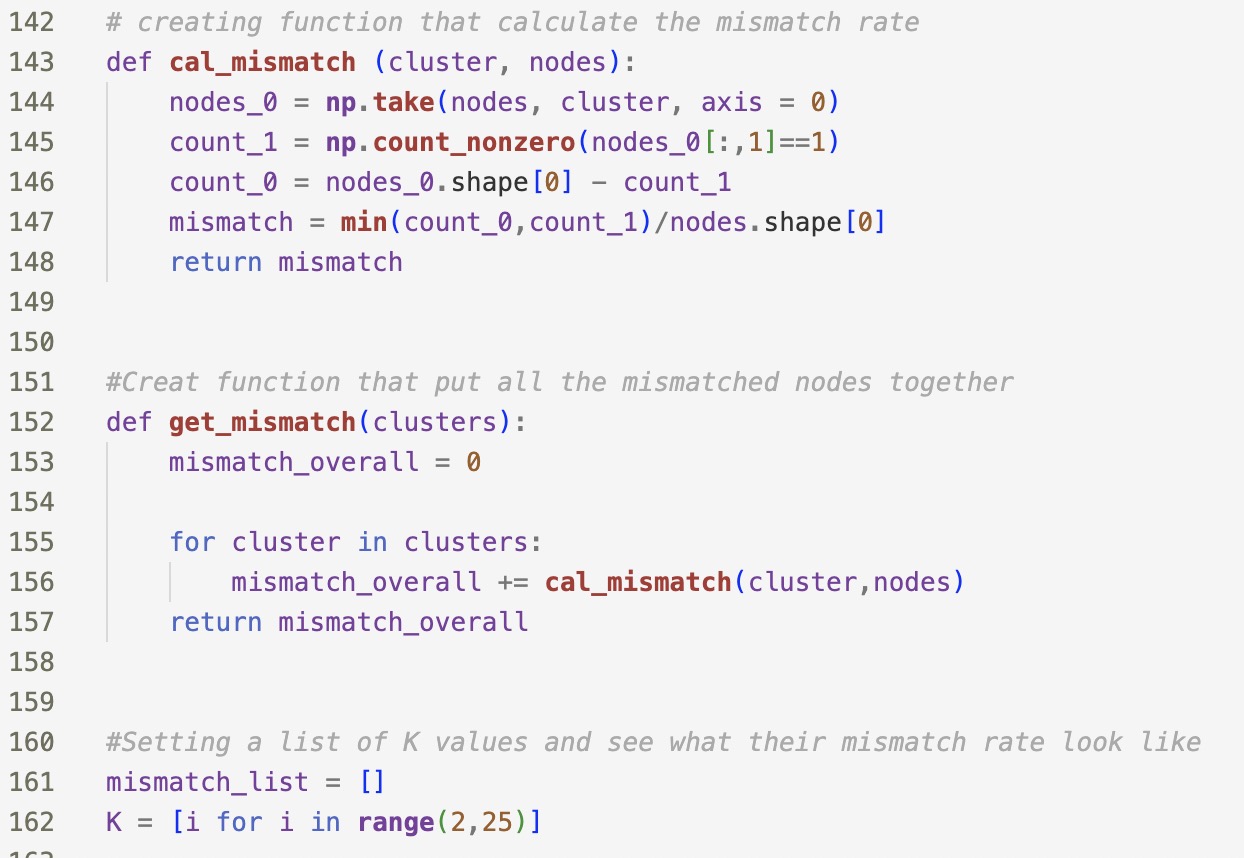
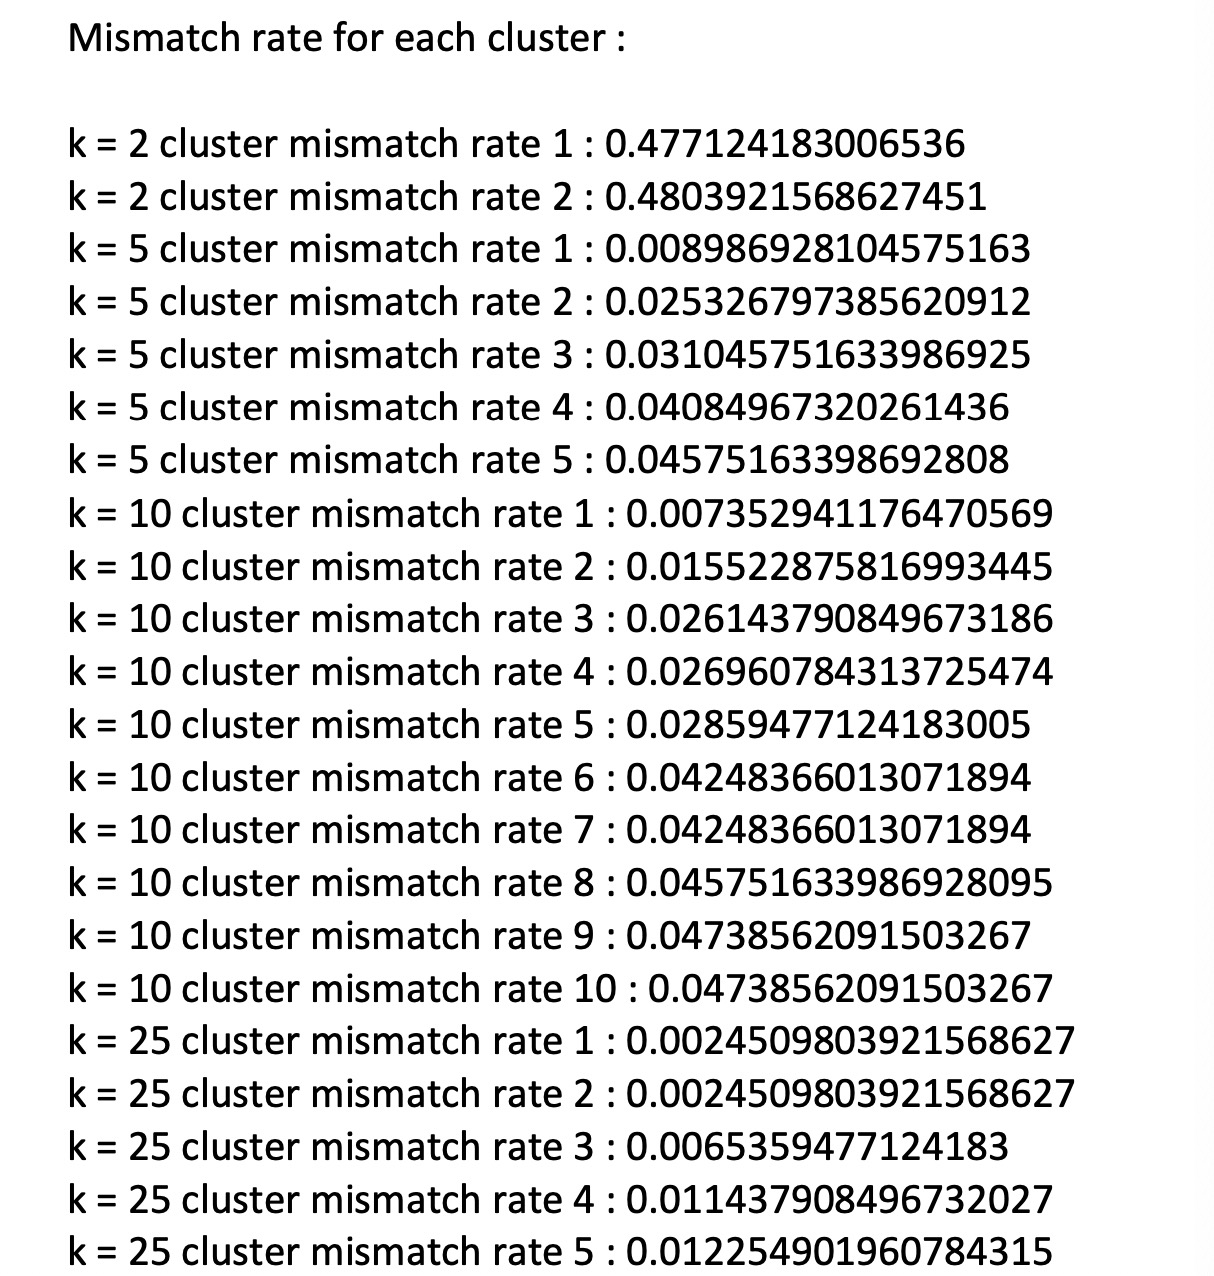
Now compare the majority label with the individual labels in each cluster, and report the mismatch rate for each cluster, when k = 2, 5, 10, 25. For instance, in the example above, the mismatch rate for the first cluster is 1/4 (only the first node differs from the majority), and the second cluster is 1/3.
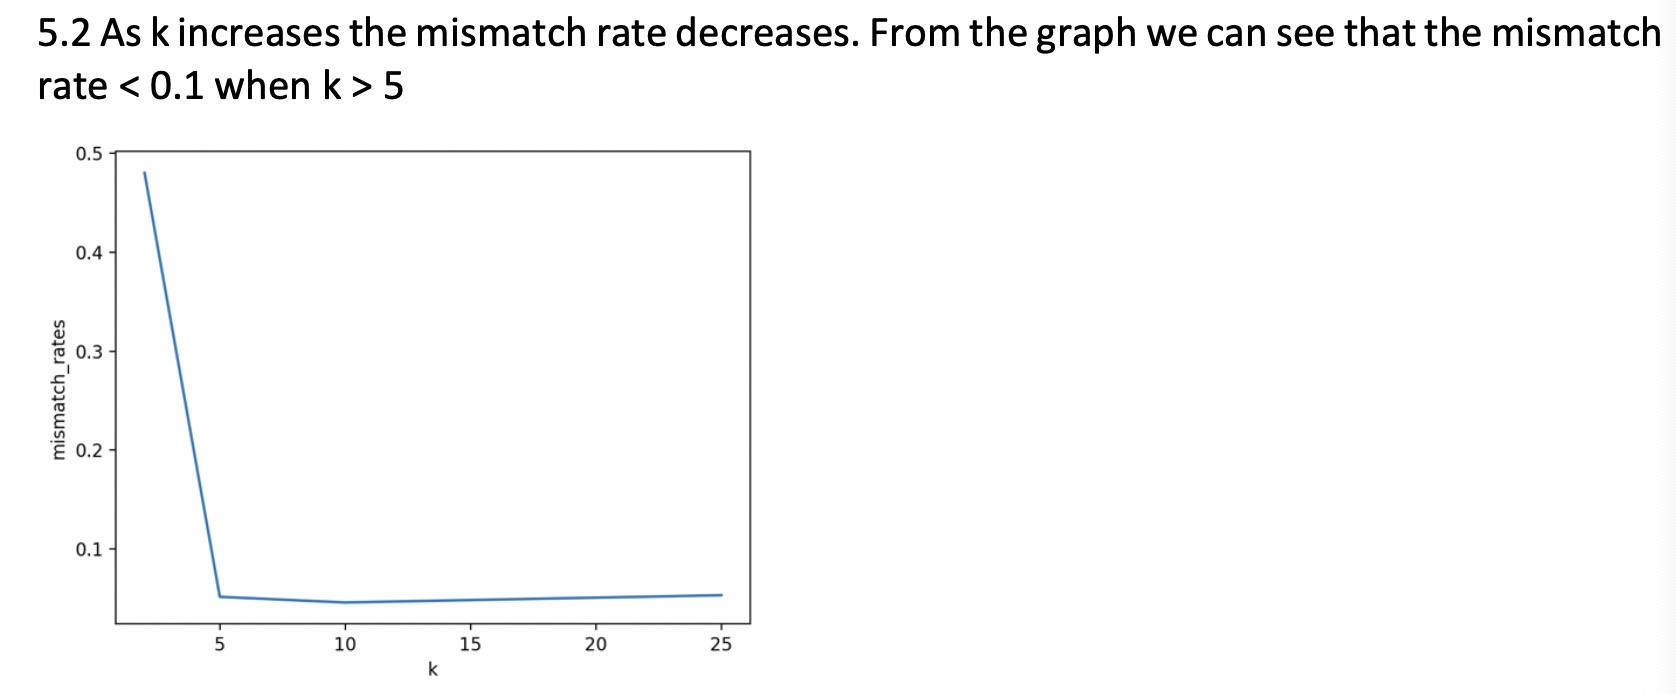
2. Tune your k and find the number of clusters to achieve a reasonably small mismatch rate. Please explain how you tune k and what is the achieved mismatch rate. Please explain intuitively what this result tells about the network community structure.
I've already seen the conceptual questions on youtube, so don't answer the conceptual questions. I checked every step of the code, but I still couldn't get the right answer.
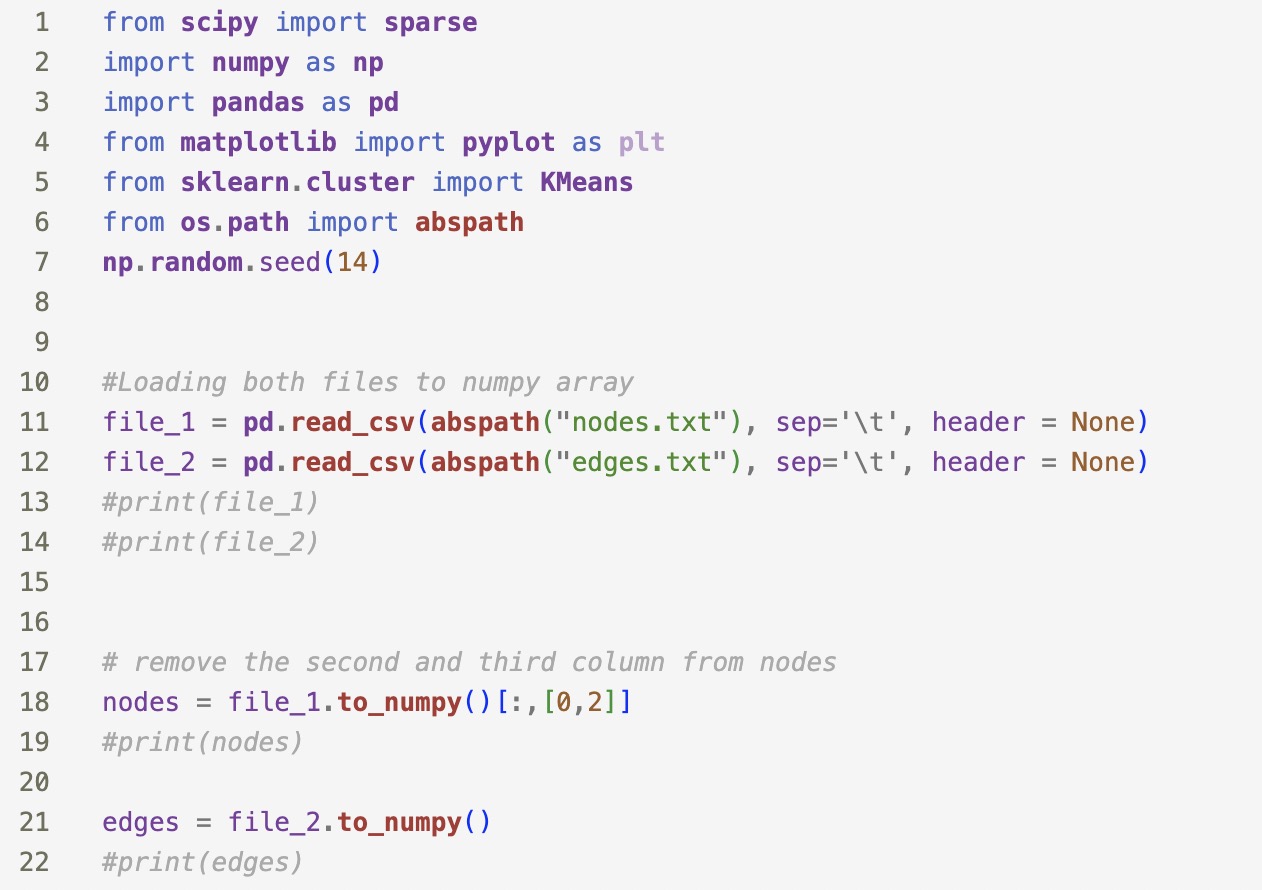
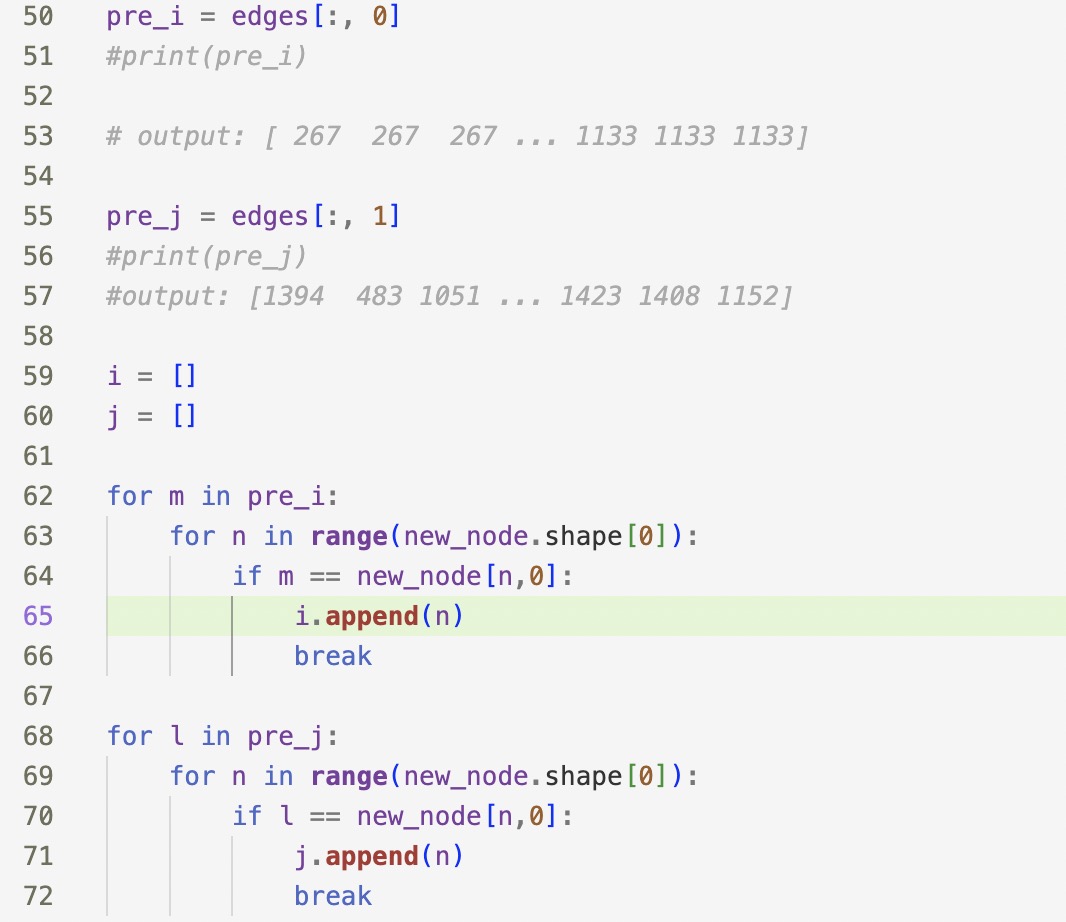
This is my code:
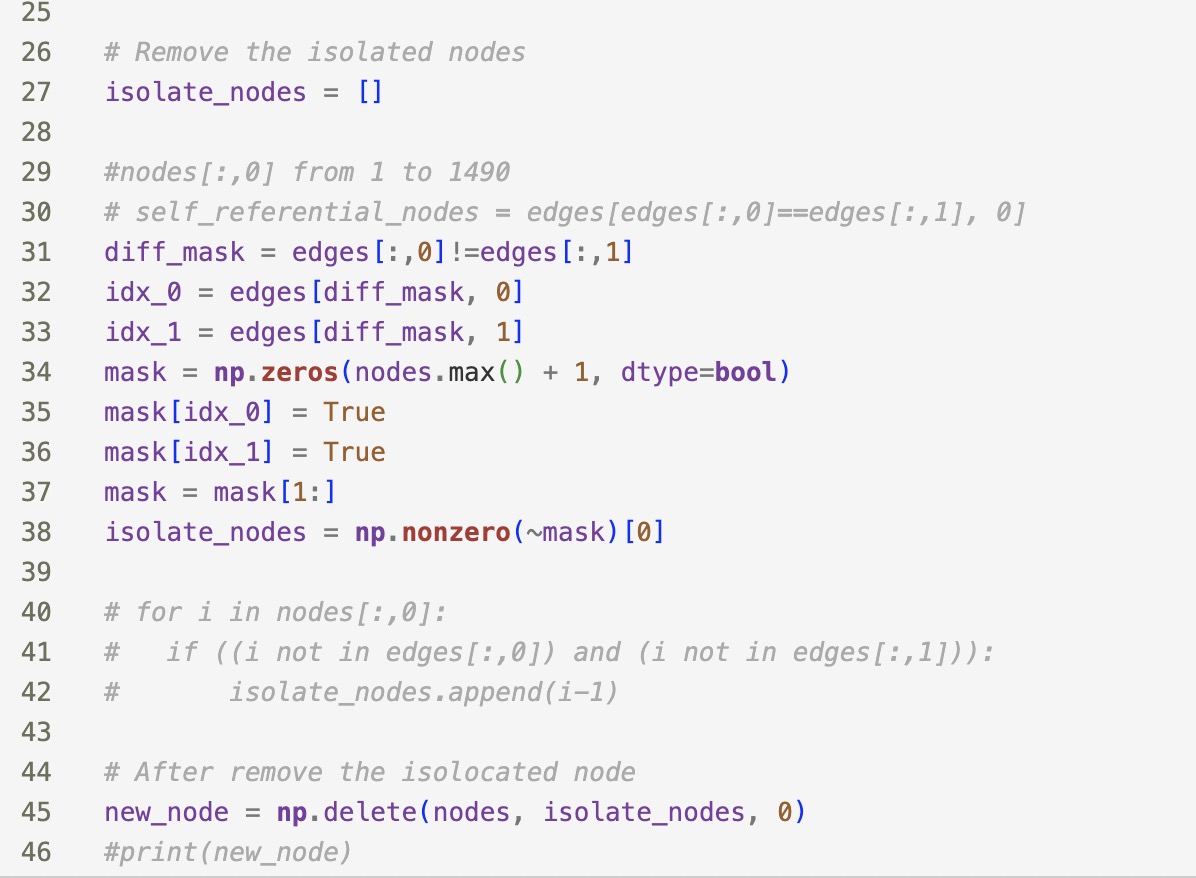
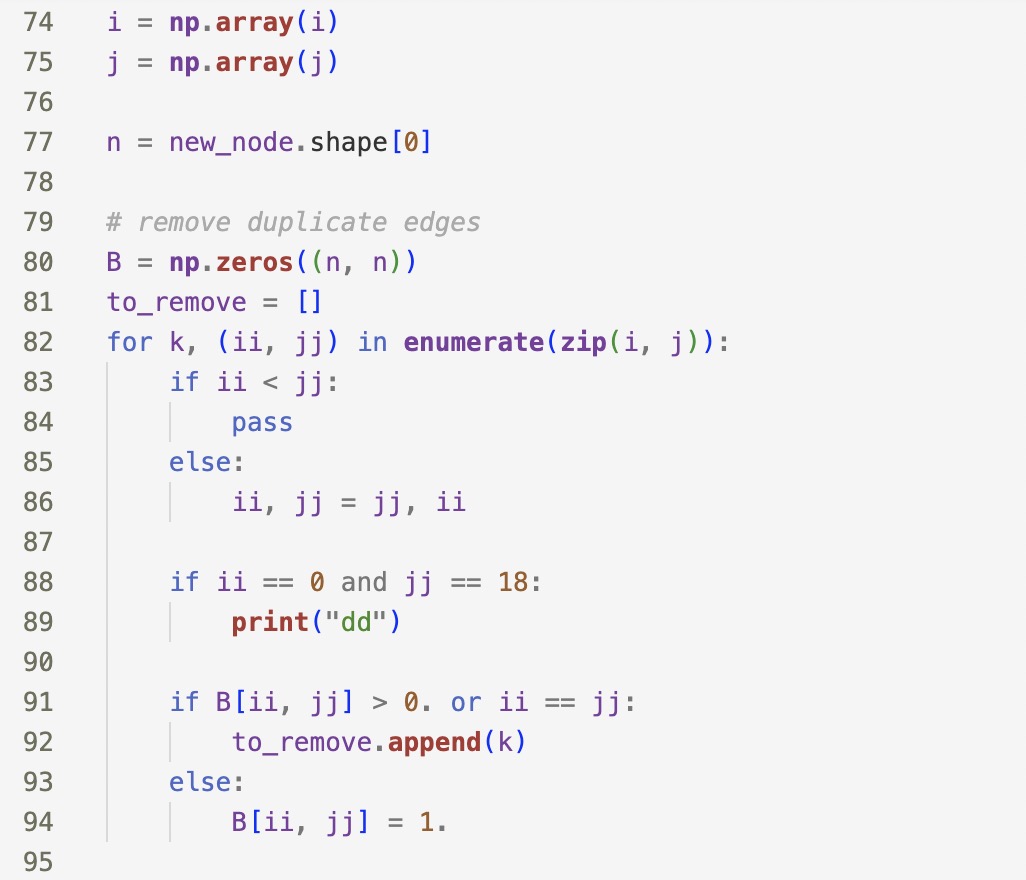
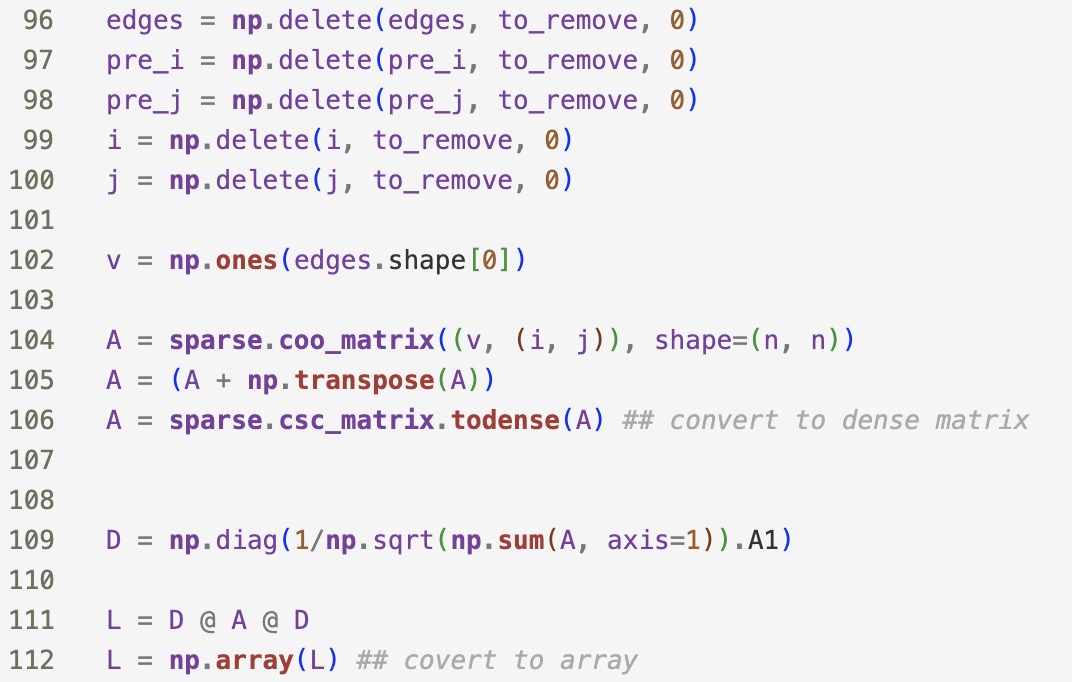
I have checked the above code and deleted the redundant edge on the same node.
![third column from nodes nodes file_1.to_numpy ( ) [:, [0,2]] #print (nodes)](https://dsd5zvtm8ll6.cloudfront.net/si.experts.images/questions/2024/02/65c361b69c670_35065c361b67a6cb.jpg)
Here is my output:
[0.312751677852349, 0.312751677852349, 0.14093959731543626, 0.14093959731543623, 0.1375838926174497, 0.13892617449664427, 0.13892617449664427, 0.13959731543624157, 0.1395973154362416, 0.13959731543624163, 0.13758389261744963, 0.14832214765100674, 0.14496644295302016, 0.14563758389261747, 0.14496644295302014, 0.1563758389261745, 0.14630872483221474, 0.14966442953020134, 0.15033557046979862, 0.1449664429530201, 0.1442953020134228, 0.15100671140939598, 0.14563758389261744]
Please help me to modify the code, do not answer some other questions. I really don't want to waste my number of questions, thank you!
The correct answer is as follows:
May I ask how the code can get the above answer? I've been stuck on this problem for over a week. I have not found relevant information at present. Please help me modify the code after eigenvalue, here is data:
nodes.txt
1 from scipy import sparse import numpy as np 2 3 import pandas as pd 4 from matplotlib import pyplot as plt from sklearn.cluster import KMeans 5 6 from os. path import abspath 7 np. random.seed (14) 8 9 10 #Loading both files to numpy array 11 file_1 = pd. read_csv (abspath("nodes.txt"), sep='\t', header = None) file_2 = pd. read_csv (abspath("edges.txt"), sep='\t', header = None) 13 #print(file_1) 12 14 #print (file_2) 15 16 17 18 19 20 21 22 # remove the second and third column from nodes nodes file_1.to_numpy ( ) [:, [0,2]] #print (nodes) file_2.to_numpy() edges = #print (edges)
Step by Step Solution
There are 3 Steps involved in it

Get step-by-step solutions from verified subject matter experts