

Question: I submitted this a bit earlier but the earlier version did not contain latex representations of formulas. Hopefully, this will proved some clarity. Thanks! 2.
I submitted this a bit earlier but the earlier version did not contain latex representations of formulas. Hopefully, this will proved some clarity. Thanks!
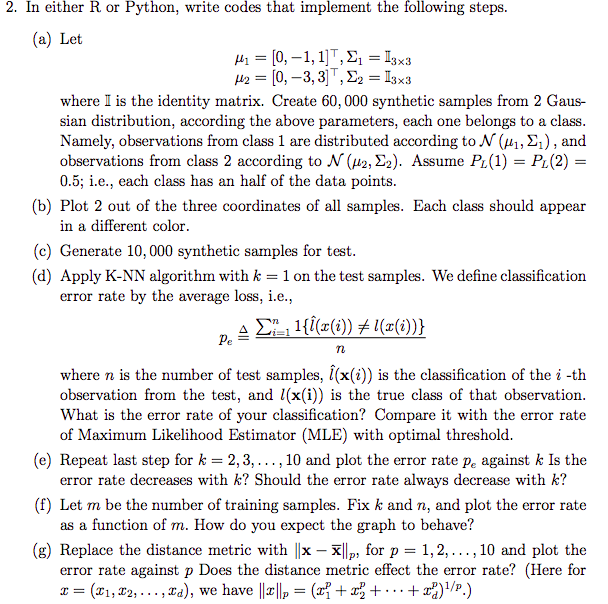
2. In either R or Python, write codes that implement the following steps. (a) Let M = [0, -1, 1], E1 = 13x3 12 = [0, -3, 3] , 22 = 13x3 where I is the identity matrix. Create 60, 000 synthetic samples from 2 Gaus- sian distribution, according the above parameters, each one belongs to a class. Namely, observations from class 1 are distributed according to N (#1, E ) , and observations from class 2 according to / (#2, Ez). Assume PL(1) = PL(2) = 0.5; i.e., each class has an half of the data points. (b) Plot 2 out of the three coordinates of all samples. Each class should appear in a different color. (c) Generate 10, 000 synthetic samples for test. (d) Apply K-NN algorithm with k = 1 on the test samples. We define classification error rate by the average loss, i.e., where n is the number of test samples, (x()) is the classification of the i -th observation from the test, and /(x(i)) is the true class of that observation. What is the error rate of your classification? Compare it with the error rate of Maximum Likelihood Estimator (MLE) with optimal threshold. (e) Repeat last step for k = 2, 3, . . ., 10 and plot the error rate p. against & Is the error rate decreases with k? Should the error rate always decrease with k? (f) Let m be the number of training samples. Fix & and n, and plot the error rate as a function of m. How do you expect the graph to behave? (g) Replace the distance metric with | |x - X]|p; for p = 1, 2, ... . 10 and plot the error rate against p Does the distance metric effect the error rate? (Here for * = ($1, $2, . . ., I'd), we have loll, = (itz? + ..+x)1/p.)
Step by Step Solution
There are 3 Steps involved in it

Get step-by-step solutions from verified subject matter experts