

Question: I think help on part one using MATLAB Consider the following data: 4 3.5 0.9 2.6 4.5 We would like to predict the value ofy
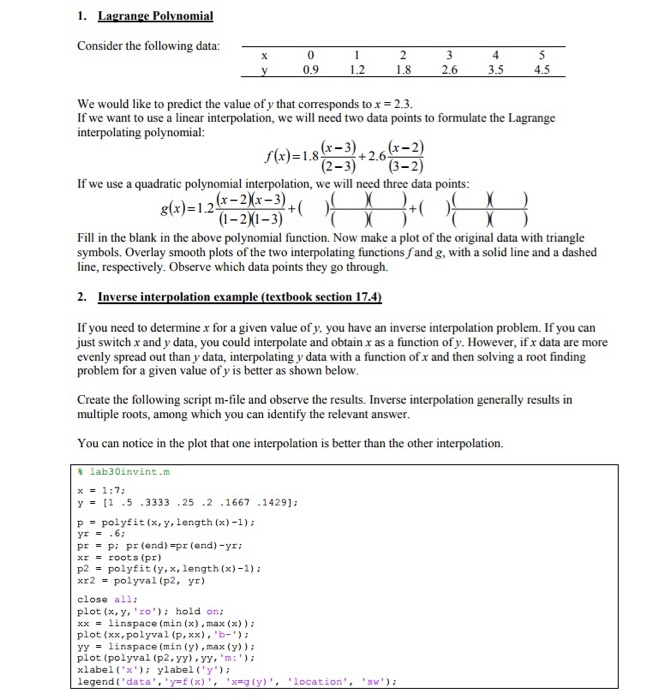
Consider the following data: 4 3.5 0.9 2.6 4.5 We would like to predict the value ofy that corresponds to x = 2.3 If we want to use a linear interpolation, we will need two data points to formulate the Lagrange 3)20 6-2) +2.6 (2-3) (3-2) If we use a quadratic polynomial interpolation, we will need three data points g(x)=1.24-2)(x-3)+( +0 Fill in the blank in the above polynomial function. Now make a plot of the original data with triangle symbols. Overlay smooth plots of the two interpolating functions fand g, with a solid line and a dashed line, respectively. Observe which data points they go through. 2. Inverse interpolation example (textbook section 17.4 If you need to determine for a given value of y, you have an inverse interpolation problem. If you can just switch x and y data, you could interpolate and obtain x as a function of y. However, if x data are more evenly spread out than y data, interpolating y data with a function of x and then solving a root finding problem for a given value of y is better as shown below Create the following script m-file and observe the results. Inverse interpolation generally results in multiple roots, among which you can identify the relevant answer You can notice in the plot that one interpolation is better than the other interpolation. 1ab30invint.m y= [1 .5 .3333 .25 .2 .1667 .1429); P = polyfit (x, y, length (x)-1); y: = .6; pr = p; pr (end)=pr(end)-yr; xroots (pr) p2 = polyfit (y, x, length (x)-1); xr2= polyval (p2, yr) close all: plot (x,y. 'xo hold on; xx = linspace (min (x), max (x)) ; plot (xx, polyval (p, xx),b-' yy = linspace (min (y) , max (y)) ; plot (polyval (p2, yy),yy,m xlabel(xylabel('y legend ('data f (x) (y)' '1ocation'' Consider the following data: 4 3.5 0.9 2.6 4.5 We would like to predict the value ofy that corresponds to x = 2.3 If we want to use a linear interpolation, we will need two data points to formulate the Lagrange 3)20 6-2) +2.6 (2-3) (3-2) If we use a quadratic polynomial interpolation, we will need three data points g(x)=1.24-2)(x-3)+( +0 Fill in the blank in the above polynomial function. Now make a plot of the original data with triangle symbols. Overlay smooth plots of the two interpolating functions fand g, with a solid line and a dashed line, respectively. Observe which data points they go through. 2. Inverse interpolation example (textbook section 17.4 If you need to determine for a given value of y, you have an inverse interpolation problem. If you can just switch x and y data, you could interpolate and obtain x as a function of y. However, if x data are more evenly spread out than y data, interpolating y data with a function of x and then solving a root finding problem for a given value of y is better as shown below Create the following script m-file and observe the results. Inverse interpolation generally results in multiple roots, among which you can identify the relevant answer You can notice in the plot that one interpolation is better than the other interpolation. 1ab30invint.m y= [1 .5 .3333 .25 .2 .1667 .1429); P = polyfit (x, y, length (x)-1); y: = .6; pr = p; pr (end)=pr(end)-yr; xroots (pr) p2 = polyfit (y, x, length (x)-1); xr2= polyval (p2, yr) close all: plot (x,y. 'xo hold on; xx = linspace (min (x), max (x)) ; plot (xx, polyval (p, xx),b-' yy = linspace (min (y) , max (y)) ; plot (polyval (p2, yy),yy,m xlabel(xylabel('y legend ('data f (x) (y)' '1ocation
Step by Step Solution
There are 3 Steps involved in it

Get step-by-step solutions from verified subject matter experts