

Question: I think I need mean, range & control limits as well. I'm so lost on this problem, please help. lol 17. (***) (Microsoft Excel problem)

I think I need mean, range & control limits as well. I'm so lost on this problem, please help. lol
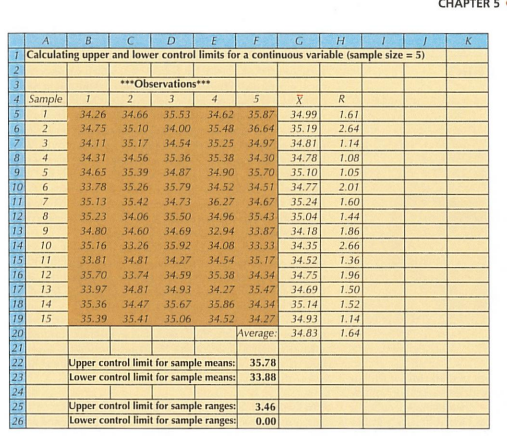
17. (***) (Microsoft Excel problem) The following Excel spread- sheet calculates the upper and lower control limits for a continuous variable. Re-create this spreadsheet in Excel. You should develop the spreadsheet so that the results will be recalculated if any of the values in the highlighted cells are changed. Your formatting does not have to be exactly the same, but the numbers should be. (As a test, see what happens if all five observations in Sample 1 are 40. Your new upper and lower control limits for the sample means should be 36.05 and 34.28, respectively.) CHAPTER 5 K B CDI E GTH 1 Calculating upper and lower control limits for a continuous variable (sample size = 5) 2 3 ***Observations*** 4 Sample 1 2 3 4 5 X R 5 1 34.26 34.66 35.53 34.62 35.87 34.99 1.61 6 2 34.75 35.10 34.00 35.48 36.64 35.19 2.64 7 3 34.11 35.17 34.54 35.25 34.97 34.81 1.14 8 4 34.31 34.56 35.36 35.38 34.30 34.78 1.08 9 5 34.65 35.39 34.87 34.90 35.70 35.10 1.05 TO 6 33.78 35.26 35.79 34.52 34.51 34.77 2.01 11 7 35.13 35.42 34.73 36.27 34.67 35.24 1.60 12 8 35.23 34.06 35.50 34.96 35.43 35.04 1.44 13 9 34.80 34.60 34.69 32.94 33.87 34.18 1.& 14 10 35.16 33.26 35.92 34.08 33.33 34.35 2.66 15 33.81 34.81 34.27 34.54 35.17 34.52 1.36 16 12 35.70 33.74 34.59 35.38 34.34 34.75 1.96 17 13 33.97 34.81 34.93 34.27 35.47 34.69 1.50 18 14 35.36 34.47 35.67 35.86 34.34 35.14 1.52 19 15 35.39 35.41 35.06 34.52 34.27 34.93 1.14 20 Average: 34.83 1.64 21 Upper controllimit for sample means: 35.78 23 Lower controllimit for sample means: 33.88 24 25 Upper control limit for sample ranges: 3.46 26 Lower control limit for sample ranges: 0.00 22 Read carefully and develop a spreadsheet to calculate Upper and Lower Control Limits (as in the picture provided). Upon completion, upload the Excel file to CanvasStep by Step Solution
There are 3 Steps involved in it
1 Expert Approved Answer
Step: 1 Unlock

Question Has Been Solved by an Expert!
Get step-by-step solutions from verified subject matter experts
Step: 2 Unlock
Step: 3 Unlock