

Question: i upload the spreadsheet as well for reference Better? A company has 100 employees who were asked to make a donation to this year's emergency
i upload the spreadsheet as well for reference
![employees made donations [12 - 7].) Part A: How many donations were](https://dsd5zvtm8ll6.cloudfront.net/si.experts.images/questions/2024/10/671636fd869a7_116671636fce9179.jpg)
Better?
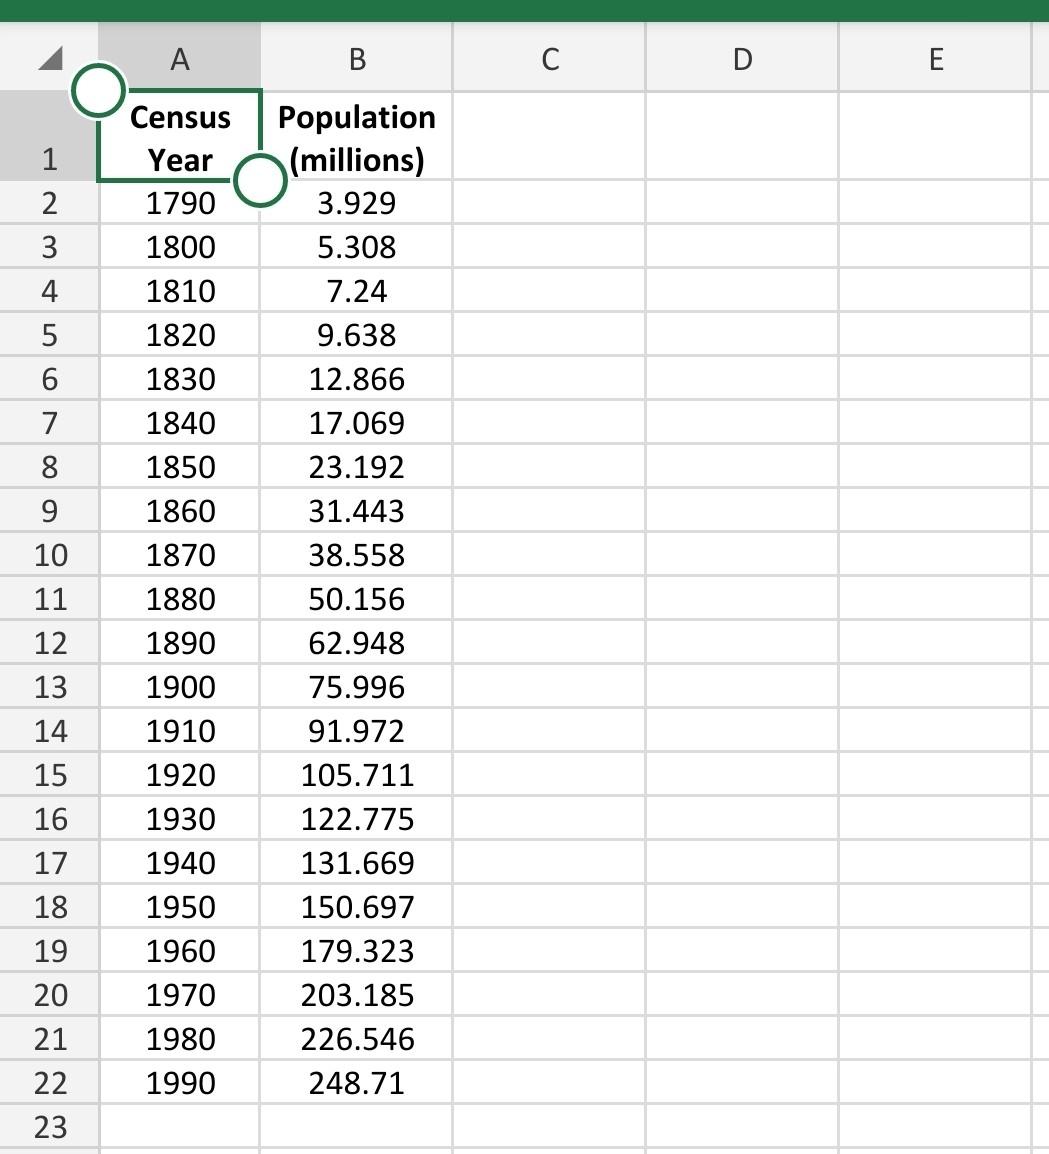
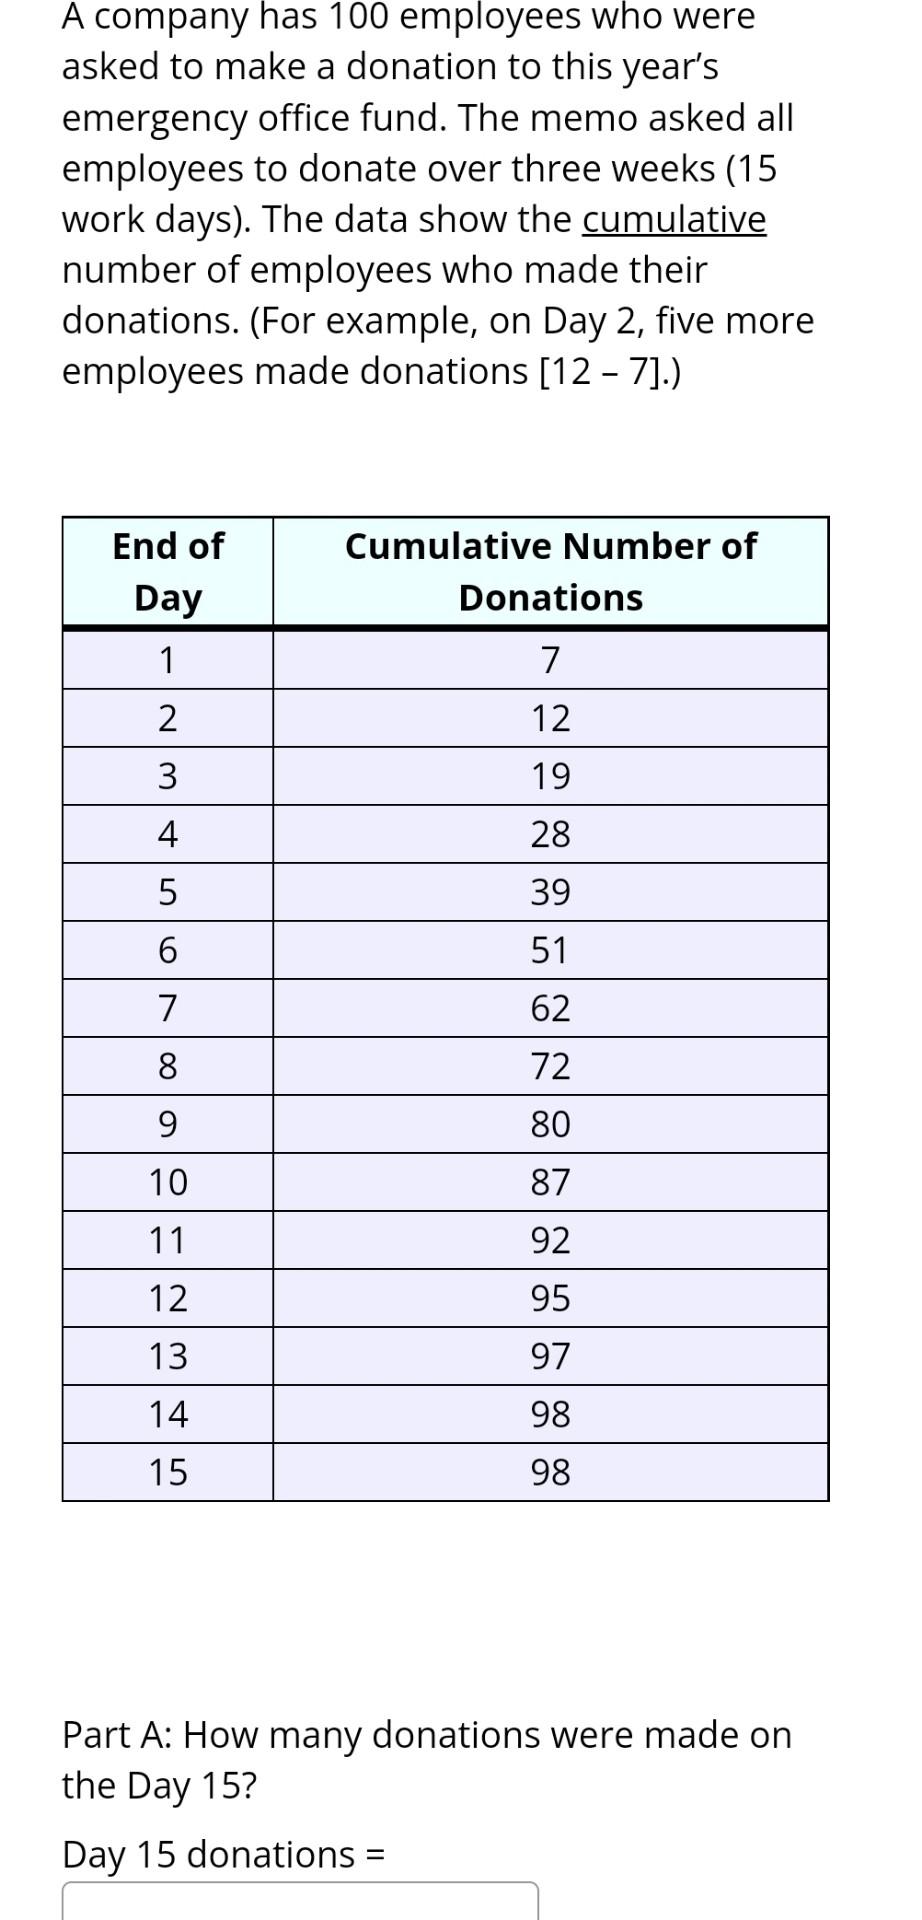
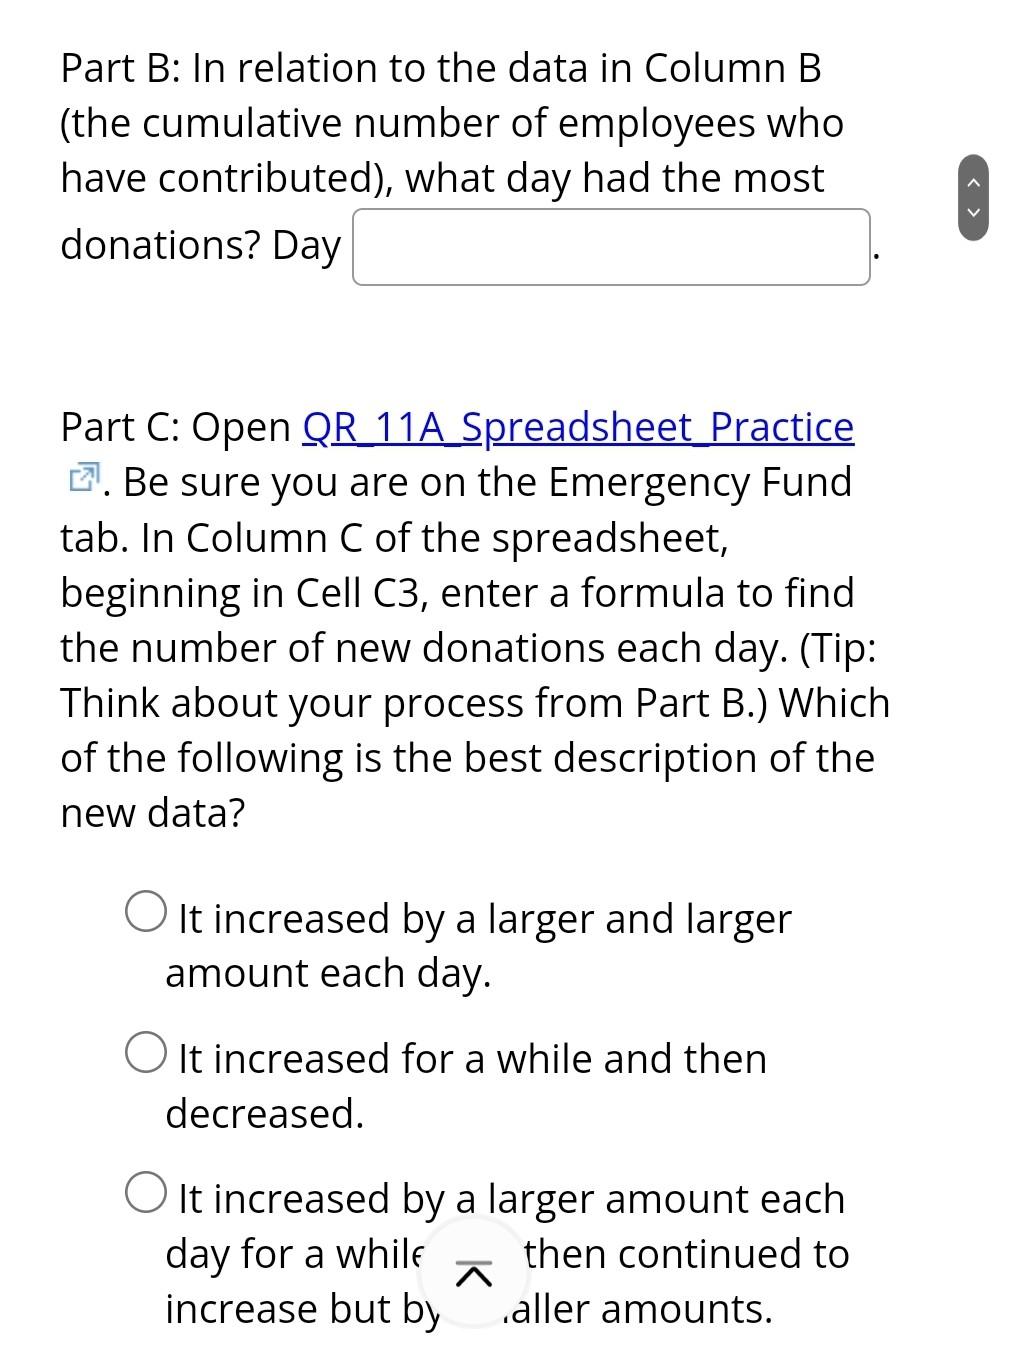
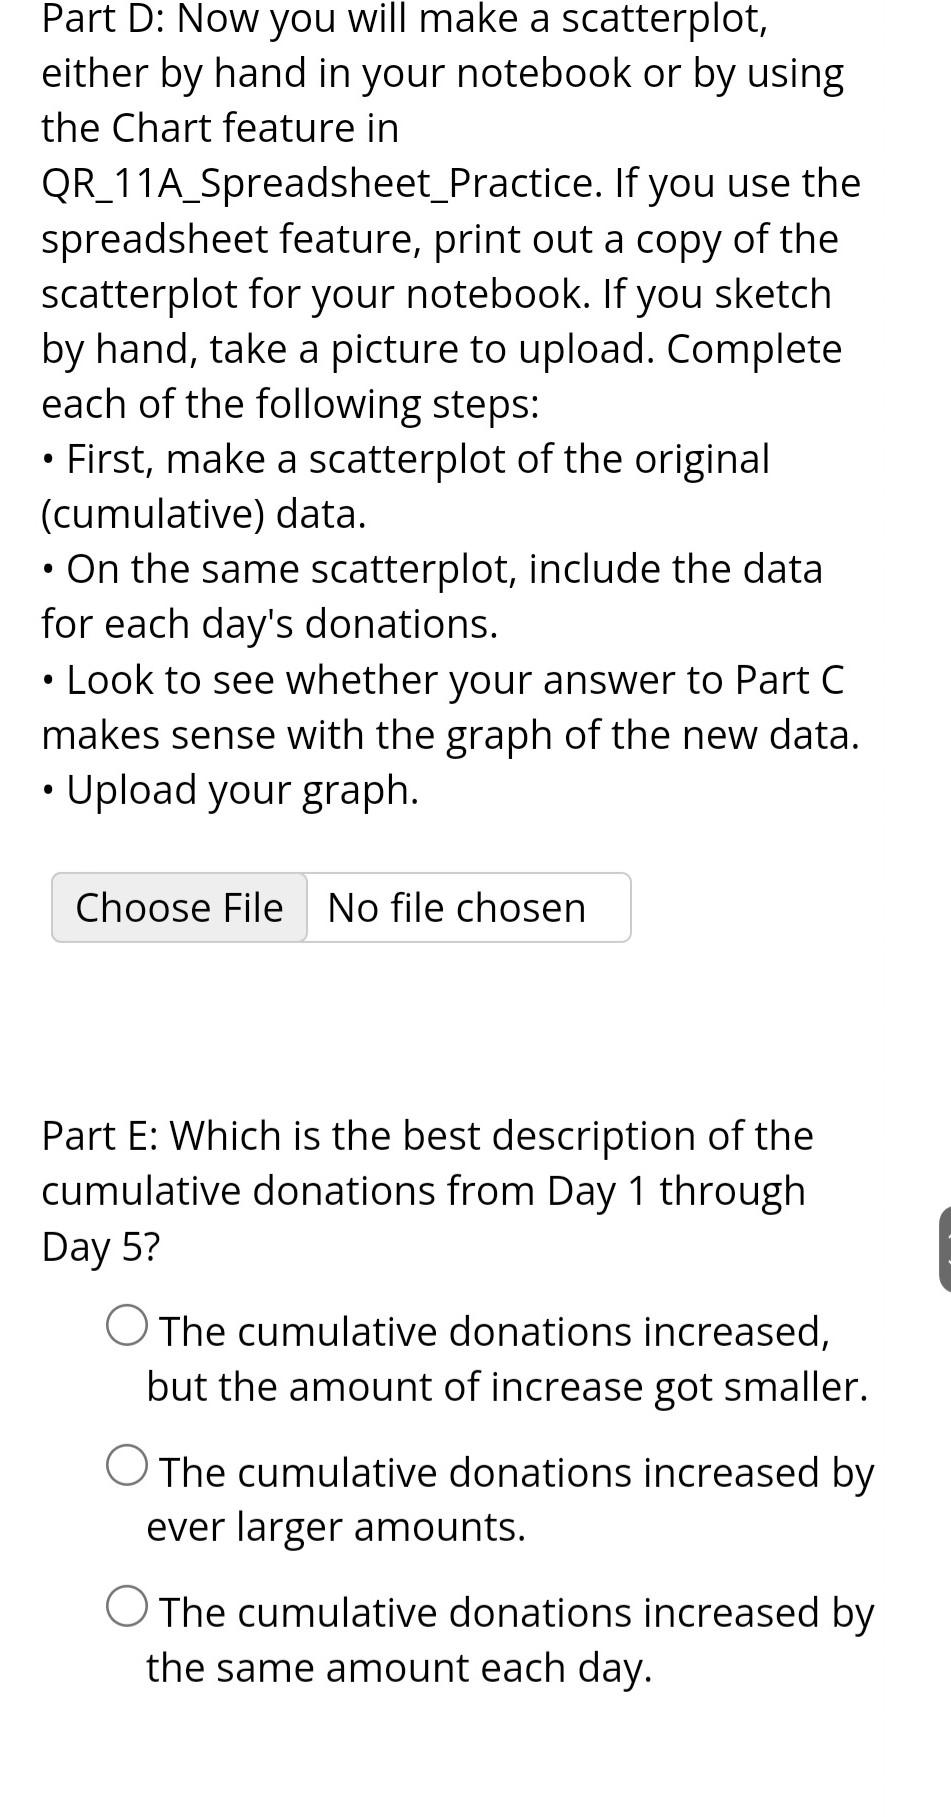
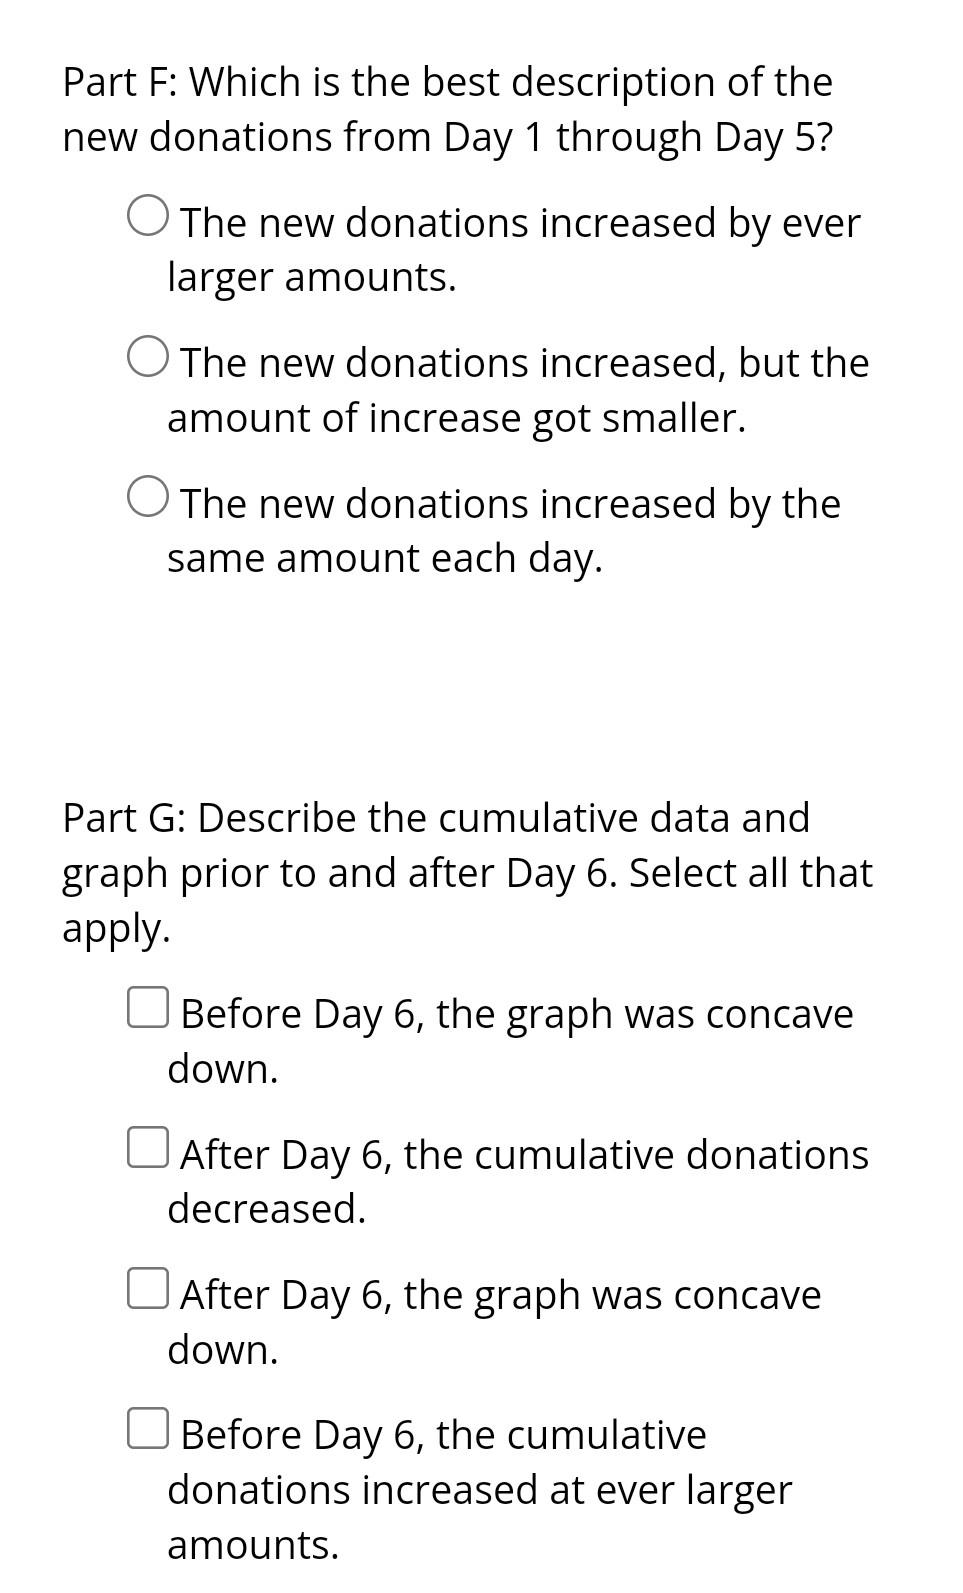
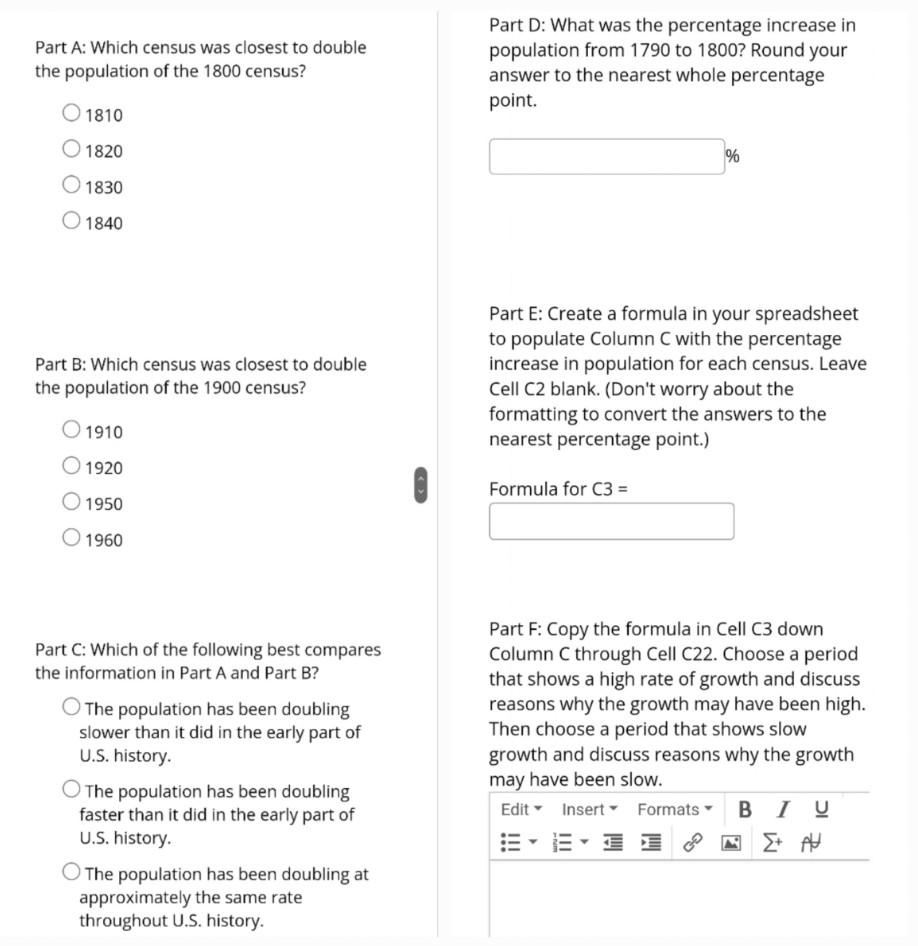
A company has 100 employees who were asked to make a donation to this year's emergency office fund. The memo asked all employees to donate over three weeks (15 work days). The data show the cumulative number of employees who made their donations. (For example, on Day 2, five more employees made donations [12 - 7].) Part A: How many donations were made on the Day 15 ? Day 15 donations = Part B: In relation to the data in Column B (the cumulative number of employees who have contributed), what day had the most donations? Day Part C: Open QR 11A Spreadsheet Practice . Be sure you are on the Emergency Fund tab. In Column C of the spreadsheet, beginning in Cell C3, enter a formula to find the number of new donations each day. (Tip: Think about your process from Part B.) Which of the following is the best description of the new data? It increased by a larger and larger amount each day. It increased for a while and then decreased. It increased by a larger amount each day for a whilf then continued to increase but by . aller amounts. Part D: Now you will make a scatterplot, either by hand in your notebook or by using the Chart feature in QR_11A_Spreadsheet_Practice. If you use the spreadsheet feature, print out a copy of the scatterplot for your notebook. If you sketch by hand, take a picture to upload. Complete each of the following steps: - First, make a scatterplot of the original (cumulative) data. - On the same scatterplot, include the data for each day's donations. - Look to see whether your answer to Part C makes sense with the graph of the new data. - Upload your graph. Part E: Which is the best description of the cumulative donations from Day 1 through Day 5? The cumulative donations increased, but the amount of increase got smaller. The cumulative donations increased by ever larger amounts. The cumulative donations increased by the same amount each day. Part F: Which is the best description of the new donations from Day 1 through Day 5 ? The new donations increased by ever larger amounts. The new donations increased, but the amount of increase got smaller. The new donations increased by the same amount each day. Part G: Describe the cumulative data and graph prior to and after Day 6. Select all that apply. Before Day 6, the graph was concave down. After Day 6, the cumulative donations decreased. After Day 6, the graph was concave down. Before Day 6, the cumulative donations increased at ever larger amounts. CDE E Part D: What was the percentage increase in Part A: Which census was closest to double population from 1790 to 1800 ? Round your the population of the 1800 census? answer to the nearest whole percentage 1810182018301840 point. Part E: Create a formula in your spreadsheet to populate Column C with the percentage Part B: Which census was closest to double increase in population for each census. Leave the population of the 1900 census? Cell C2 blank. (Don't worry about the 1910192019501960 formattingtoconverttheanswerstothenearestpercentagepoint.) FormulaforC3= Part F: Copy the formula in Cell C3 down Part C: Which of the following best compares Column C through Cell C22. Choose a period the information in Part A and Part B? that shows a high rate of growth and discuss The population has been doubling reasons why the growth may have been high. slower than it did in the early part of Then choose a period that shows slow U.S. history. growth and discuss reasons why the growth The population has been doubling mav have been slow. faster than it did in the early part of U.S. history. The population has been doubling at approximately the same rate throughout U.S. history
Step by Step Solution
There are 3 Steps involved in it

Get step-by-step solutions from verified subject matter experts