

Question: I want a Histogram plotting code in jupyter langauge 1 - contains a read function from csv file as showing 2 - 5 cites to
I want a Histogram plotting code in jupyter langauge
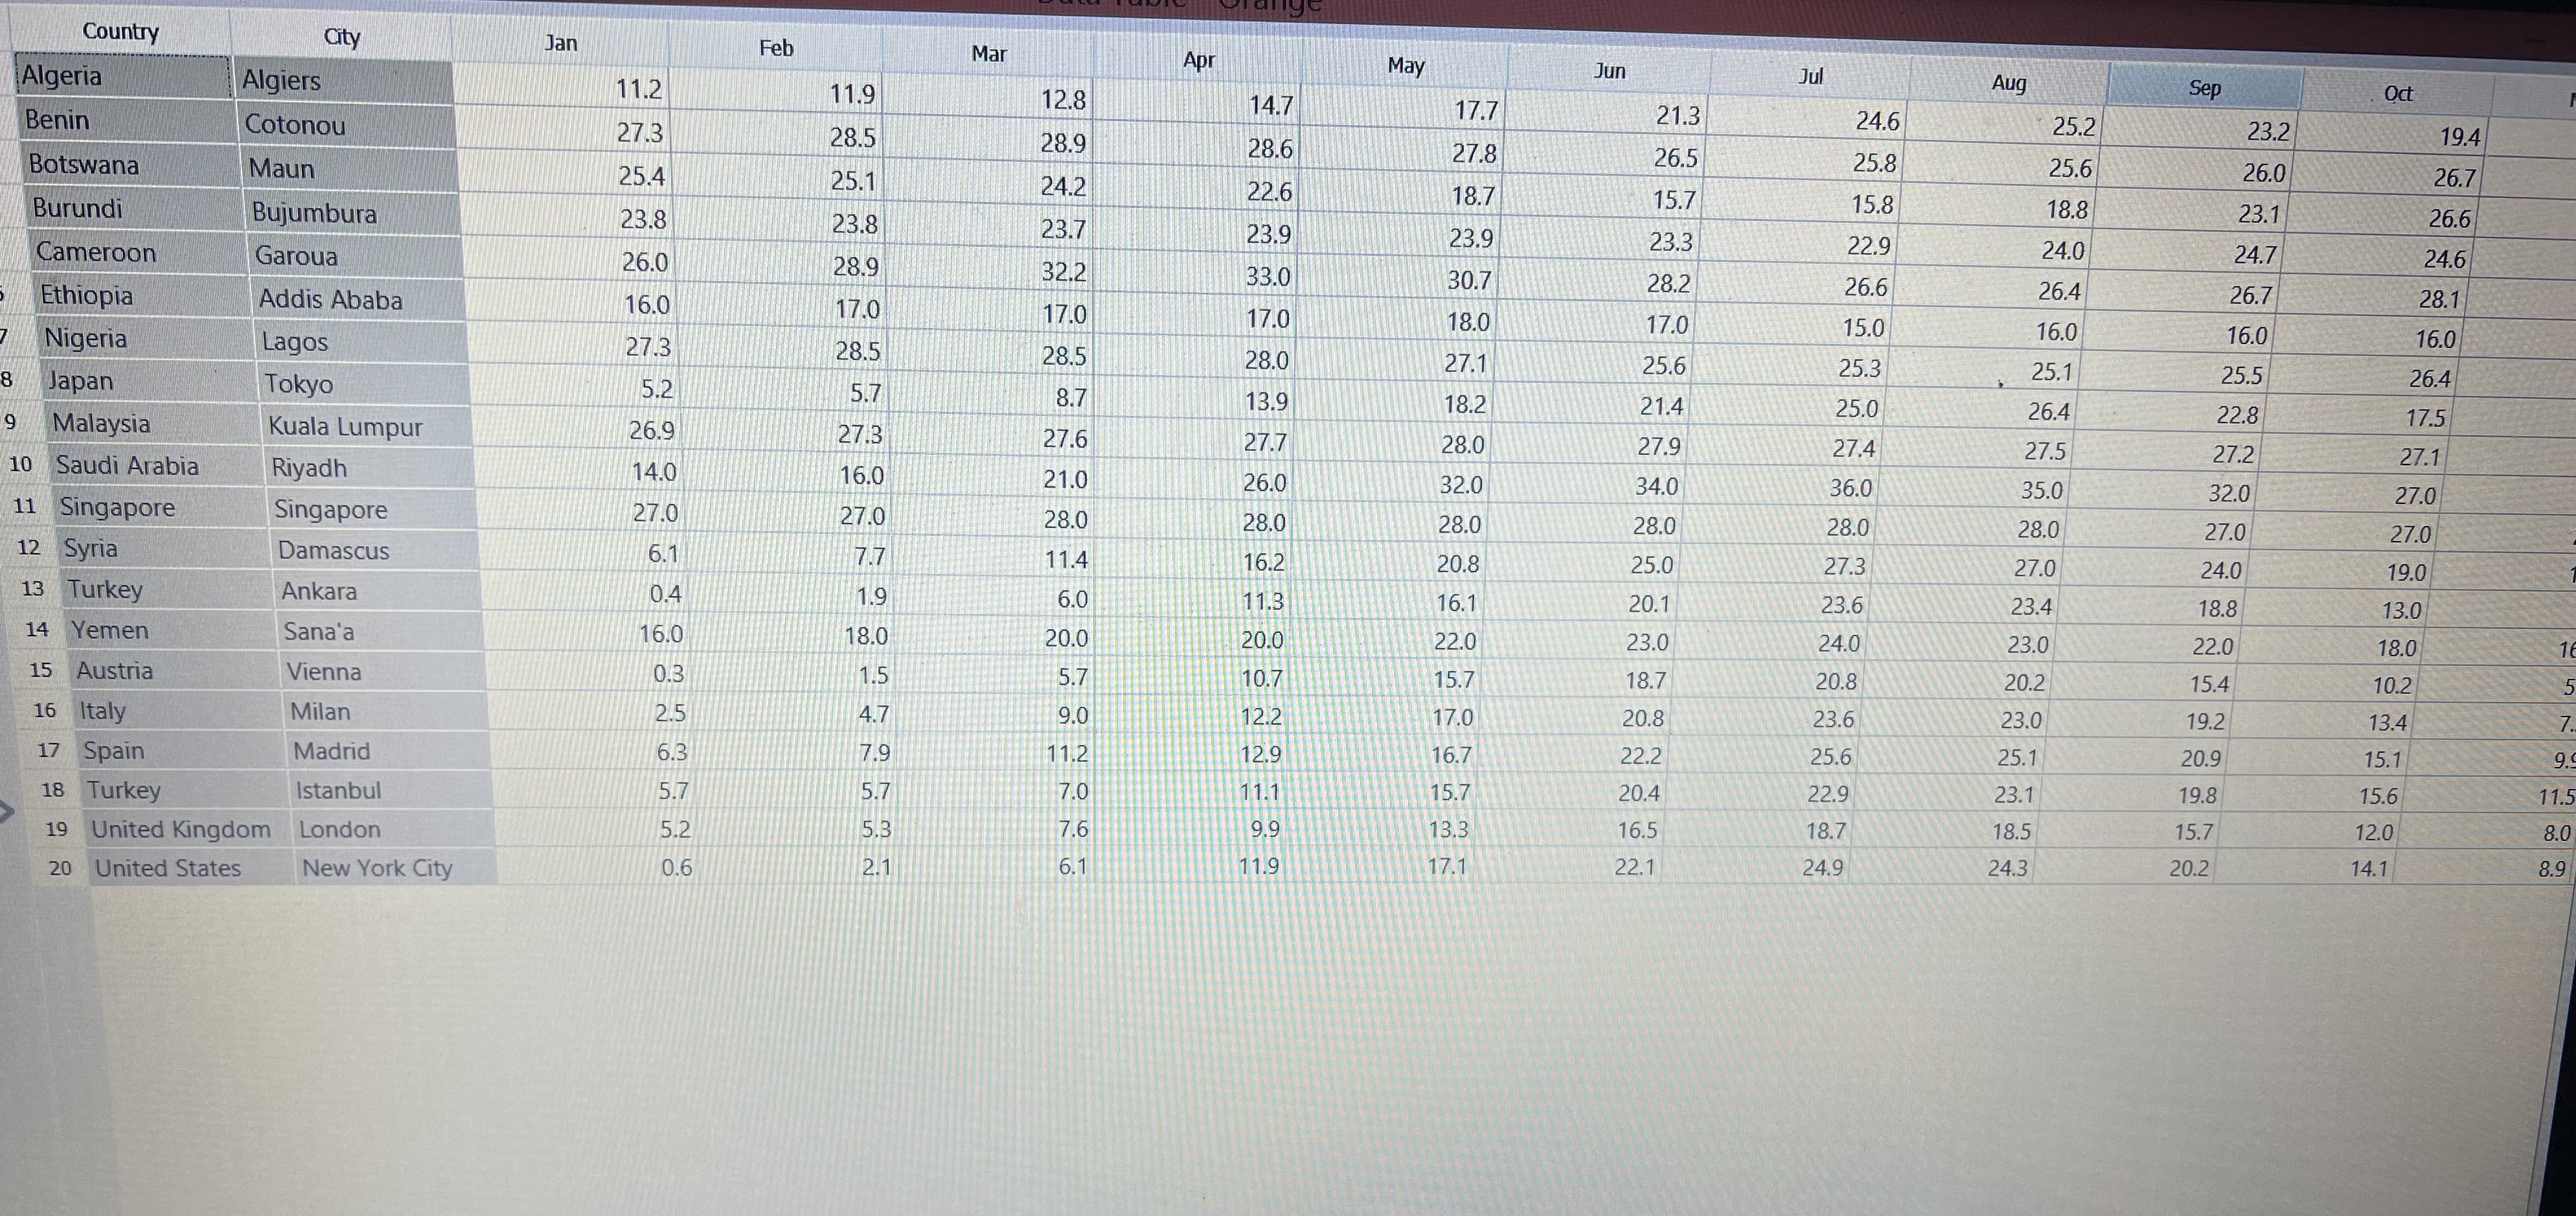
contains a read function from csv file as showing
cites to be displayed with crosspend it month that contain tempreature values
cities are riyadh, tokoyo, vieena,new yotk city
disply the values of all month tempreature for each city
x axis contains months
y axis contain temprature
Step by Step Solution
There are 3 Steps involved in it
1 Expert Approved Answer
Step: 1 Unlock

Question Has Been Solved by an Expert!
Get step-by-step solutions from verified subject matter experts
Step: 2 Unlock
Step: 3 Unlock