

Question: I want an explanation for this example Question 1 options: 1. A relative frequency histogram for set of data representing playing times (in seconds) for
I want an explanation for this example
Question 1 options:
1. A relative frequency histogram for set of data representing playing times (in seconds) for a sample of popular songs is shown below.
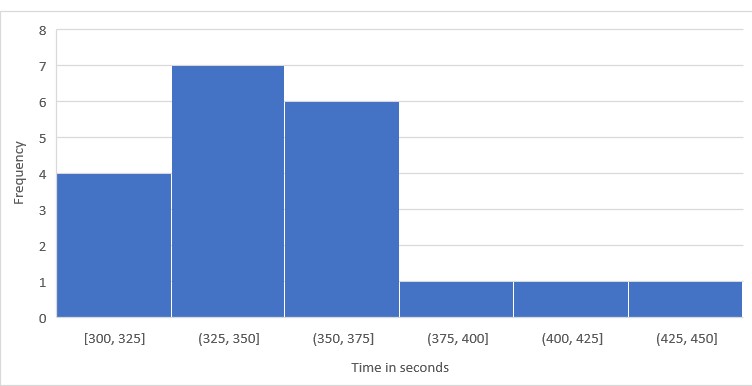
8 6 5 Frequency 4 3 2 1 0 [300, 325] (325, 350] (350, 375] (375, 400] (400, 425] (425, 450] Time in seconds
Step by Step Solution
There are 3 Steps involved in it
1 Expert Approved Answer
Step: 1 Unlock

Question Has Been Solved by an Expert!
Get step-by-step solutions from verified subject matter experts
Step: 2 Unlock
Step: 3 Unlock