

Question: I want Full solutions d2 Problem 2. The following table gives the average daily production figure for 20 months each of 25 working days. Given
I want Full solutions
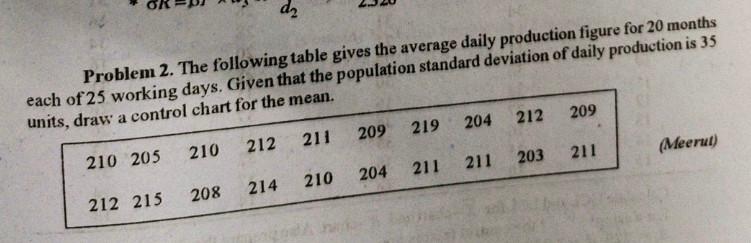
d2 Problem 2. The following table gives the average daily production figure for 20 months each of 25 working days. Given that the population standard deviation of daily production is 35 units, draw a control chart for the mean. 209 212 204 219 209 211 210 212 (Meerut) 211 210 205 203 211 211 210 204 208 214 212 215Step by Step Solution
There are 3 Steps involved in it
1 Expert Approved Answer
Step: 1 Unlock

Question Has Been Solved by an Expert!
Get step-by-step solutions from verified subject matter experts
Step: 2 Unlock
Step: 3 Unlock