

Question: I want help to plot this graph by using Matlab script.I write this by using following way. X = -3:0.01:3; X = X'; pd1 =
 I want help to plot this graph by using Matlab script.I write this by using following way.
X = -3:0.01:3; X = X'; pd1 = normpdf(X, 0, 1); pd2 = normpdf(X, 1, 1); pd3 = normpdf(X, 2, 1); pd4 = normpdf(X, 3, 1); Y1 = ones(size(X)); Y2 = 2.*Y1; Y3 = 3.*Y1; Y4 = 4.*Y1; %Plot the results plot3(X, Y1 , pd1); hold on; plot3(X, Y2 , pd2); plot3(X, Y3 , pd3); plot3(X, Y4 , pd4); hold off; xlabel('X'), ylabel('Y'), zlabel('PDF');
now i need to use loop to compute this easily.can anyone help me to complete this?
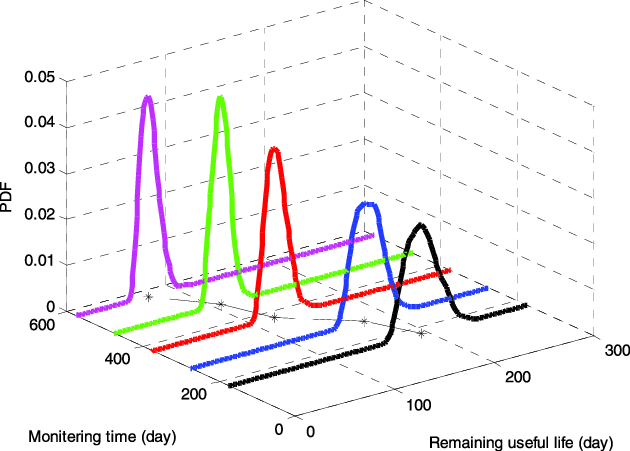
- - 0.05-Y- 0.04 L 0.03 0.02 - - 0.01 ? ? 0 600 300 400 200 200 100 Monitering time (day) Remaining useful life (day) - - 0.05-Y- 0.04 L 0.03 0.02 - - 0.01 ? ? 0 600 300 400 200 200 100 Monitering time (day) Remaining useful life (day)
Step by Step Solution
There are 3 Steps involved in it

Get step-by-step solutions from verified subject matter experts