

Question: I want the COMPLETE PYTHON CODE FOR THIS VRP _ TSP ( ESPECIALLY UNTIL QUESTION 2 ) using gurobi: import math from gurobipy import GRB
I want the COMPLETE PYTHON CODE FOR THIS VRPTSP ESPECIALLY UNTIL QUESTION using gurobi: import math
from gurobipy import GRB
import gurobipy as gp
import networkx as nx
ANSWER WHAT I AM ASKING, PLEASE!!!
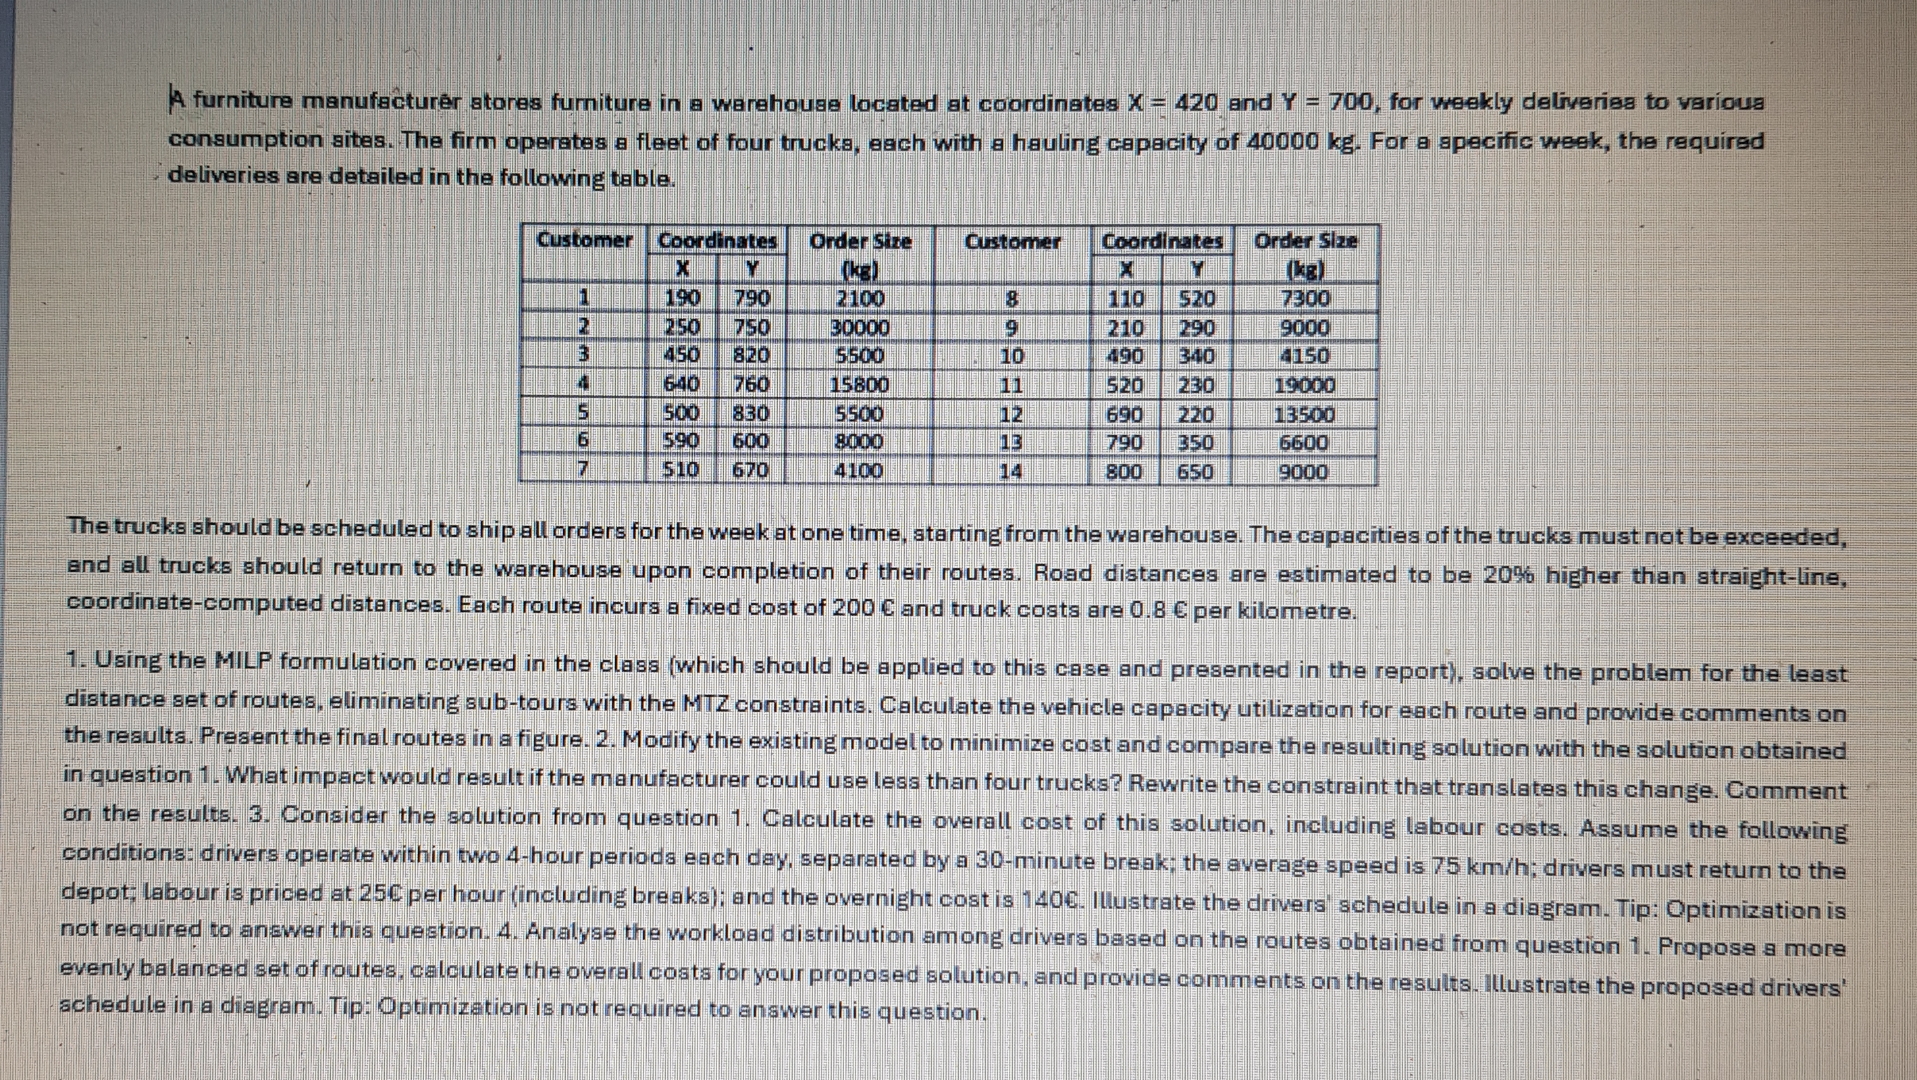
A furniture manufacturer stores fumiture in a warehouse located at coordinates and for weekly deliveries to various
consumption sites. The firm operates a fleet of four trucks, each with a hauling capacity of For a specific week, the required
deliveries are detailed in the following table.
The trucks should be scheduled to ship all orders for the week at one time, starting from the warehouse. The capacities of the trucks must not be exceeded, and all trucks should return to the warehouse upon completion of their routes. Road distances are estimated to be higher than straightline, coordinatecomputed distances. Each route incurs a fixed cost of and truck costs are per kilometre.
QUsing the MILP formulation, solve the problem for the least
distance set of routes, eliminating subtours with the MTZ constraints. Calculate the vehicle capacity utilization for each route and provide comments on the reaults. Present the final routes in a figure. Q Modify the existing model to minimize cost and compare the resulting solution with the solution obtained in question What impact would result if the manufacturer could use less than four trucks? Rewrite the constraint that translates this change. Comment on the results. Q Consider the solution from question Calculate the overall cost of this solution, including labour costs. Assume the following
conditions: drivers operate within two hour periods each day, separated by a minute break; the average speed is ; drivers must return to the depot; labour is priced at C per hour including breaks; and the overnight cost is Illustrate the drivers' schedule in a diagram. Tip: Optimization is not required to answer this question. Q Analyse the workload distribution among drivers based on the routes obtained from question Propose a more evenly balanced set of routes, calculate the overall costs for your proposed solution, and provide comments on the results. Illustrate the proposed drivers' schedule in a diagram. Tip: Optimization is not required to answer this question.
Step by Step Solution
There are 3 Steps involved in it
1 Expert Approved Answer
Step: 1 Unlock

Question Has Been Solved by an Expert!
Get step-by-step solutions from verified subject matter experts
Step: 2 Unlock
Step: 3 Unlock