

Question: I want to plot multiple density curves in a single graph like the attached one. In this graph I want variable values (fixed) in one
I want to plot multiple density curves in a single graph like the attached one. In this graph I want variable values (fixed) in one axis say X, normal pdf values in Z and how many parameter set is being used in Y axis... Can anybody please help me regarding this??? Thanks in advance...
Data set can be like this:
X = -3:0.01:3; X = X';
pd1 = normpdf(X, 0, 1);
pd2 = normpdf(X, 1, 1);
pd3 = normpdf(X, 2, 1);
pd4 = normpdf(X, 3, 1);
In X axis it will contain X values. In Z axis it will show pd values and in Y axis it will show 1, 2, 3, 4.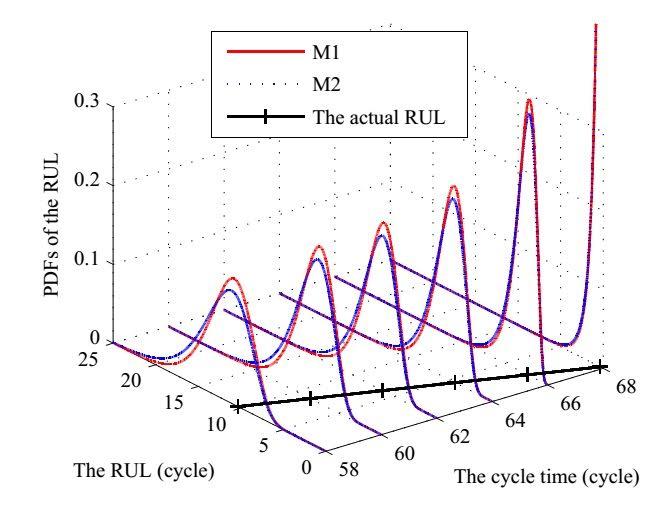
-MI M2 0.3 The actual RUL 0.2 0 25 20 68 15 10 64 62 60 The RUL (cycle) 0 58 The cycle time (cycle)
Step by Step Solution
There are 3 Steps involved in it
1 Expert Approved Answer
Step: 1 Unlock

Question Has Been Solved by an Expert!
Get step-by-step solutions from verified subject matter experts
Step: 2 Unlock
Step: 3 Unlock