

Question: I want to write a MATLAB code to draw the intensity of a LED. I have a data set of angle (20, 40, 60, 80,
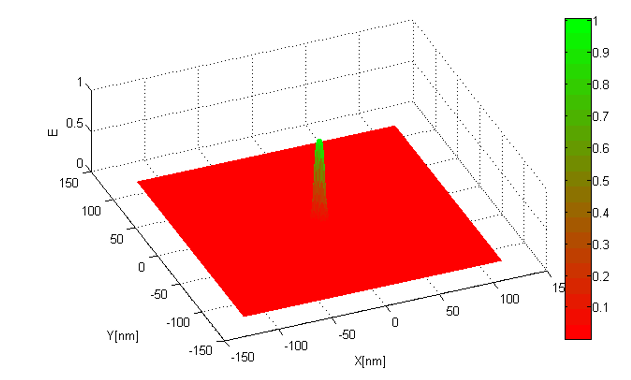
I want to write a MATLAB code to draw the intensity of a LED. I have a data set of angle (20, 40, 60, 80, 110, 130, 150) and its lux are (14, 20, 26, 30, 27, 21, 13) respectively. The height is 1m fixed. The graph should be similar to the above where it also shows the intensity bar. The code is above (I COPIED THIS FROM SOMEONE ELSE ONLINE. THIS IS NOT MY CODE OR PLOT). Please help with MATLAB codes also!
0.9 0.8 0.7 0.6 0.5 0.4 0.3 0.2 0.1 0.5 0 150 100 50 0 -50 100 50 100 YInm150 150 100 0 100 m) [X Y] = meshgrid(-120:1:120); % x,y range -120:120 nm r- sqrtx."2 + Y.*2 ); R 5.1; % fixing R to 5.1 nm figure; surf X, Y, (R.*6)./(R.46 r.*6 ), EdgeColor''none) xlabel('X[nm]); ylabel('Y[nm]) zlabel('E) colormap 1:-0.05:0; 0:.05:1 zeros( 1, numel(0:.05:1)]; colorbar; 0.9 0.8 0.7 0.6 0.5 0.4 0.3 0.2 0.1 0.5 0 150 100 50 0 -50 100 50 100 YInm150 150 100 0 100 m) [X Y] = meshgrid(-120:1:120); % x,y range -120:120 nm r- sqrtx."2 + Y.*2 ); R 5.1; % fixing R to 5.1 nm figure; surf X, Y, (R.*6)./(R.46 r.*6 ), EdgeColor''none) xlabel('X[nm]); ylabel('Y[nm]) zlabel('E) colormap 1:-0.05:0; 0:.05:1 zeros( 1, numel(0:.05:1)]; colorbar
Step by Step Solution
There are 3 Steps involved in it

Get step-by-step solutions from verified subject matter experts