

Question: I was able to figure out the scatterplot but I'm having trouble seeing if I got R correct and doing the predictions on the bottom.
I was able to figure out the scatterplot but I'm having trouble seeing if I got R correct and doing the predictions on the bottom.
(round decimals to the thousandths place at each step)
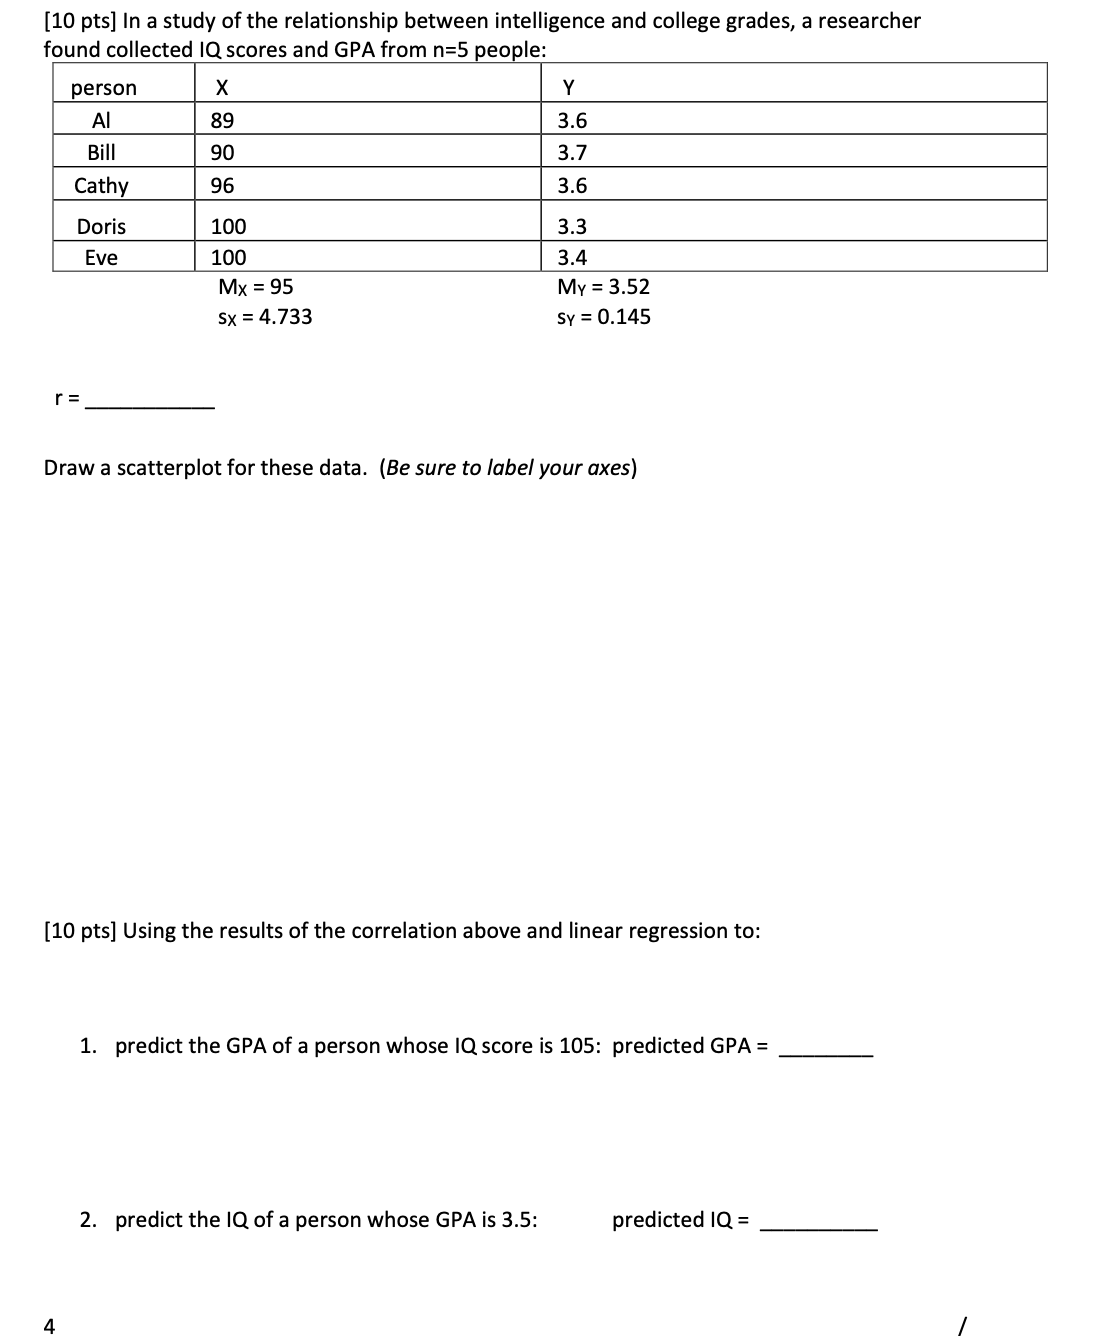
[10 pts] In a study of the relationship between intelligence and college grades, a researcher found collected IQ scores and GPA from n=5 people: person X Y Al 89 3.6 Bill 90 3.7 Cathy 96 3.6 Doris 100 3.3 Eve 100 3.4 Mx = 95 MY = 3.52 SX = 4.733 SY = 0.145 r= Draw a scatterplot for these data. (Be sure to label your axes) [10 pts] Using the results of the correlation above and linear regression to: 1. predict the GPA of a person whose IQ score is 105: predicted GPA = 2. predict the IQ of a person whose GPA is 3.5: predicted IQ =
Step by Step Solution
There are 3 Steps involved in it

Get step-by-step solutions from verified subject matter experts