

Question: I was given the information below and am not understanding the calculations or what I'm doing wrong for the table at the bottom, can someone
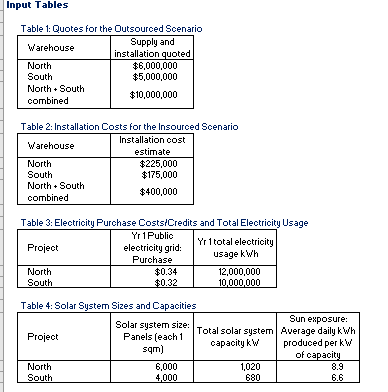
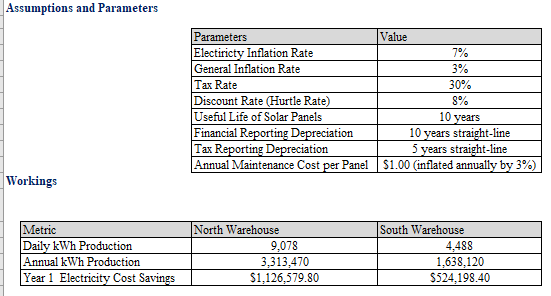
I was given the information below and am not understanding the calculations or what I'm doing wrong for the table at the bottom, can someone please break it down to me?

Step by Step Solution
There are 3 Steps involved in it
1 Expert Approved Answer
Step: 1 Unlock

Question Has Been Solved by an Expert!
Get step-by-step solutions from verified subject matter experts
Step: 2 Unlock
Step: 3 Unlock